
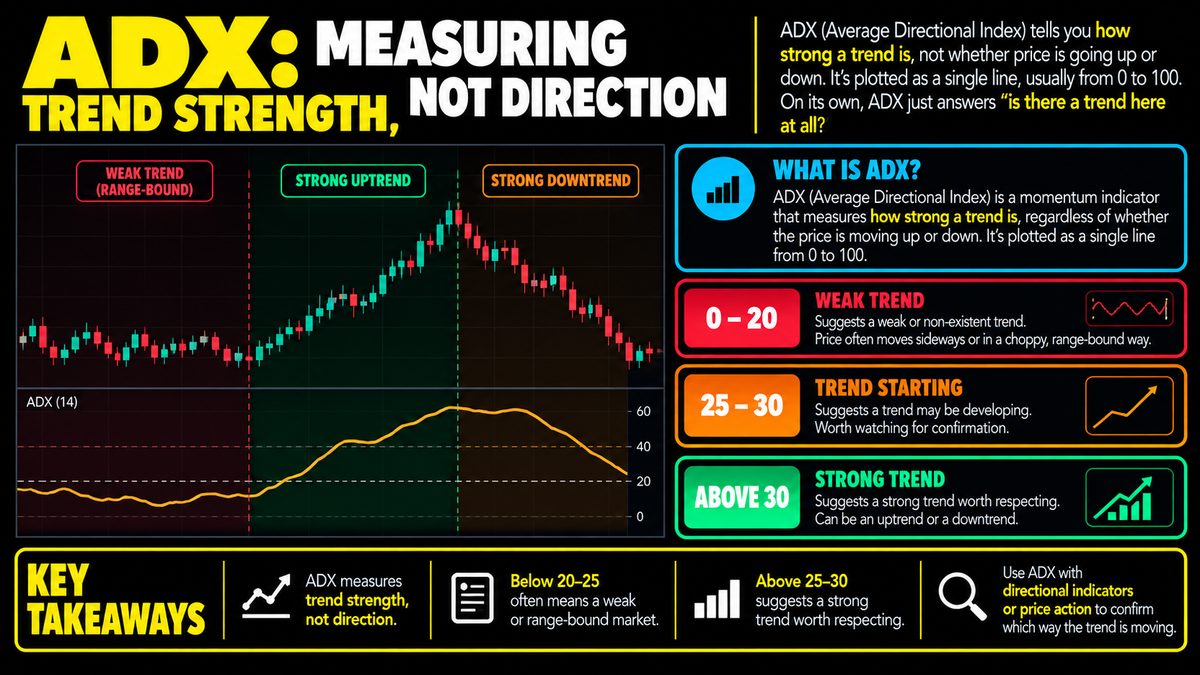
ADX tells you how strong a trend is, not whether price is going up or down. It's plotted as a single line, usually from 0 to 100 — readings below 20-25 suggest a weak or non-existent trend (often choppy, range-bound price action), while readings above 25-30 suggest a strong trend worth respecting. Many traders pair ADX with directional indicators or price action to confirm which way that strong trend is actually moving. On its own, ADX just answers "is there a trend here at all?"
What ADX Actually Measures
The Average Directional Index, or ADX, is an indicator built to answer one specific question: is price moving in a sustained, directional way, or is it just drifting back and forth without going anywhere. It does not tell you whether a market is rising or falling. It only tells you how much conviction is behind whatever movement is happening. This distinction trips up a lot of beginners, because the natural assumption when looking at any chart line is that "up" means bullish and "down" means bearish. With ADX, that is not the case at all.
ADX is plotted as a single line, typically on a scale from 0 to 100, though in practice it rarely spends much time near the extremes. It is derived from price's directional movement over a chosen period, smoothing out the noise to produce a reading that reflects trend strength rather than trend direction.
How the Readings Are Usually Interpreted
A common rule of thumb among traders is that ADX readings below roughly 20 to 25 suggest a weak or absent trend, meaning the market may be range-bound, choppy, or moving sideways without a clear bias. Readings above roughly 25 to 30 suggest a stronger, more established trend that may be worth paying closer attention to. These thresholds are not fixed laws of physics, just widely used rough guides that many traders have adopted over time, and different traders adjust them based on the asset or timeframe they are watching.
It is also worth noting that ADX can stay elevated during a trend that is losing momentum, and it can rise even as price reverses direction, since a strong downtrend produces just as high an ADX reading as a strong uptrend. The line itself is indifferent to which way price is heading.
Why Direction Needs a Separate Tool
Because ADX only speaks to strength, traders who want to know the direction of a trend typically pair it with other tools. Some use the two directional indicators that are often calculated alongside ADX, which show whether upward or downward price movement is currently dominant. Others simply look at price action itself, such as recent highs and lows, to judge direction and use ADX only as a filter for whether that direction seems to have real force behind it.
The common approach is treating ADX as a screening tool. A trader might watch for ADX moving above a chosen threshold as a signal that a market is trending, and only then turn to other analysis to decide whether that trend appears upward or downward, and whether it fits their broader strategy.
Common Mistakes and Limitations
A frequent error is treating ADX as a standalone trading signal, buying or selling purely because the line crossed above 25. ADX is a lagging measure, built from past price movement, so it tends to confirm a trend after it has already been underway rather than predicting one before it starts. A rising ADX does not guarantee the trend will continue, and a falling ADX does not guarantee a reversal.
It also performs differently across assets and timeframes, so thresholds that seem meaningful on one chart may not translate cleanly to another.
Fitting ADX Into a Broader Approach
ADX works best as one input among several, combined with price structure, volume, other indicators, and a clear risk management plan that accounts for position sizing and stop losses. No single tool, including ADX, can guarantee outcomes in markets, and it should never be relied on in isolation for decision making.