
Crypto Trading Academy
Free guides on chart patterns, indicators, and core trading concepts — plain explanations, no signup required.
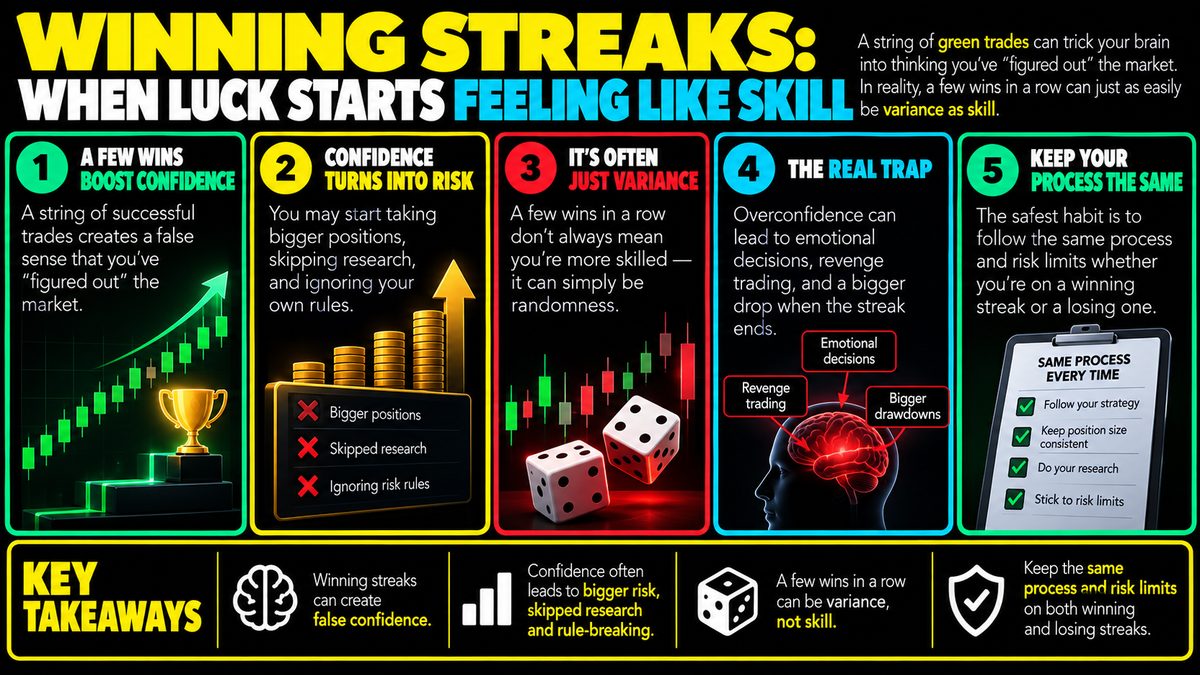
Winning Streaks: Luck vs Skill in Trading
A string of green trades can trick your brain into thinking you've "figured out" the market. That confidence often leads to bigger position sizes, skipped research, and ignoring…
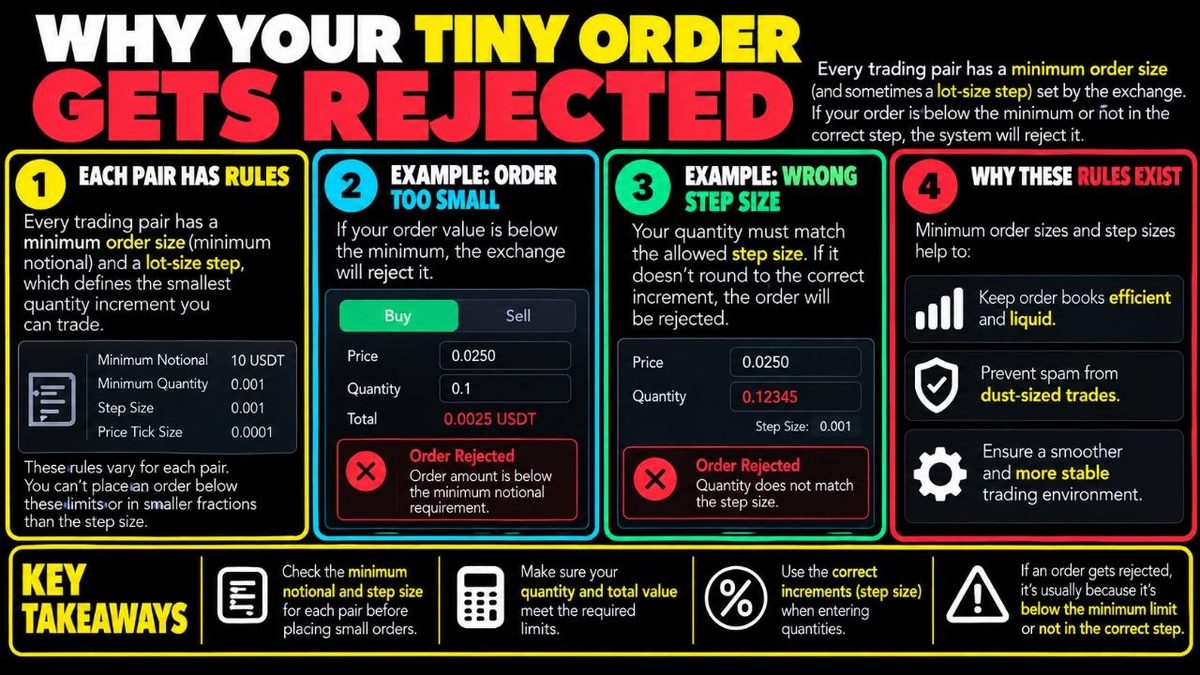
Minimum Order Size: Why Exchanges Reject Tiny Trades
Every trading pair has a minimum order size (and sometimes a "lot size" step) set by the exchange, meaning you can't buy or sell below a certain quantity or in fractions smaller…
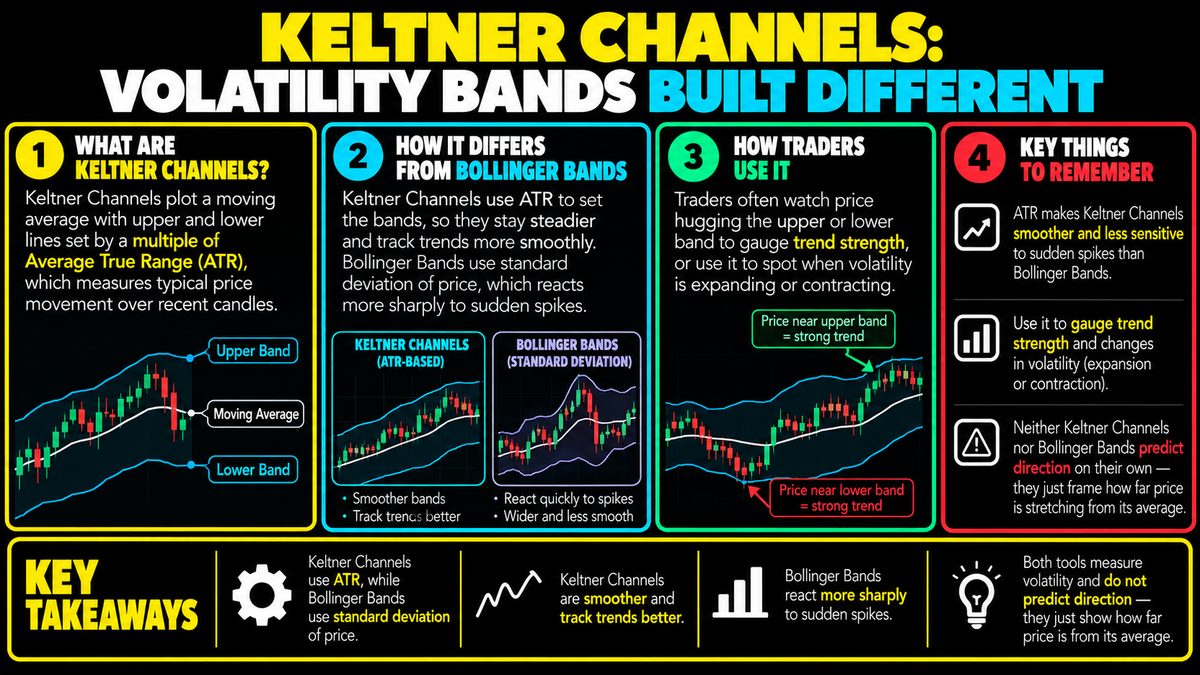
Keltner Channels: How ATR-Based Volatility Bands Work
Keltner Channels plot a moving average with upper and lower lines set by a multiple of Average True Range (ATR), which measures typical price movement over recent candles. Unlike…
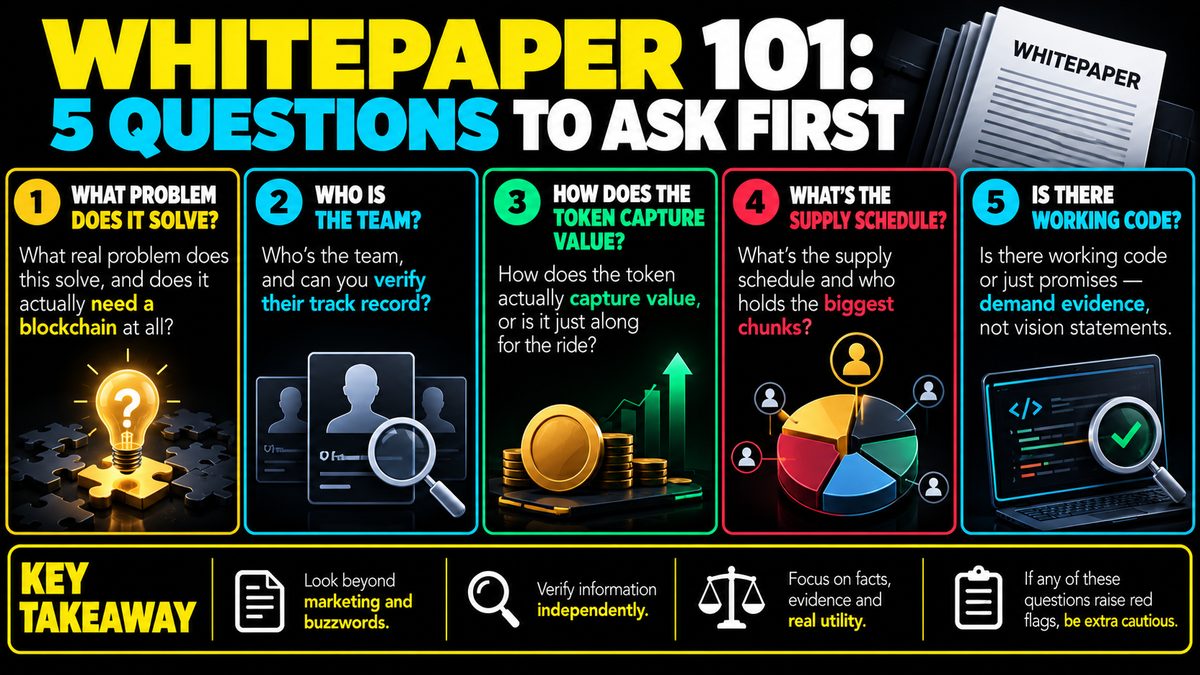
How to Evaluate a Whitepaper: 5 Key Questions
Before diving into technical jargon, ask: What real problem does this solve, and does it need a blockchain at all? Who's the team, and can you verify their track record? How does…
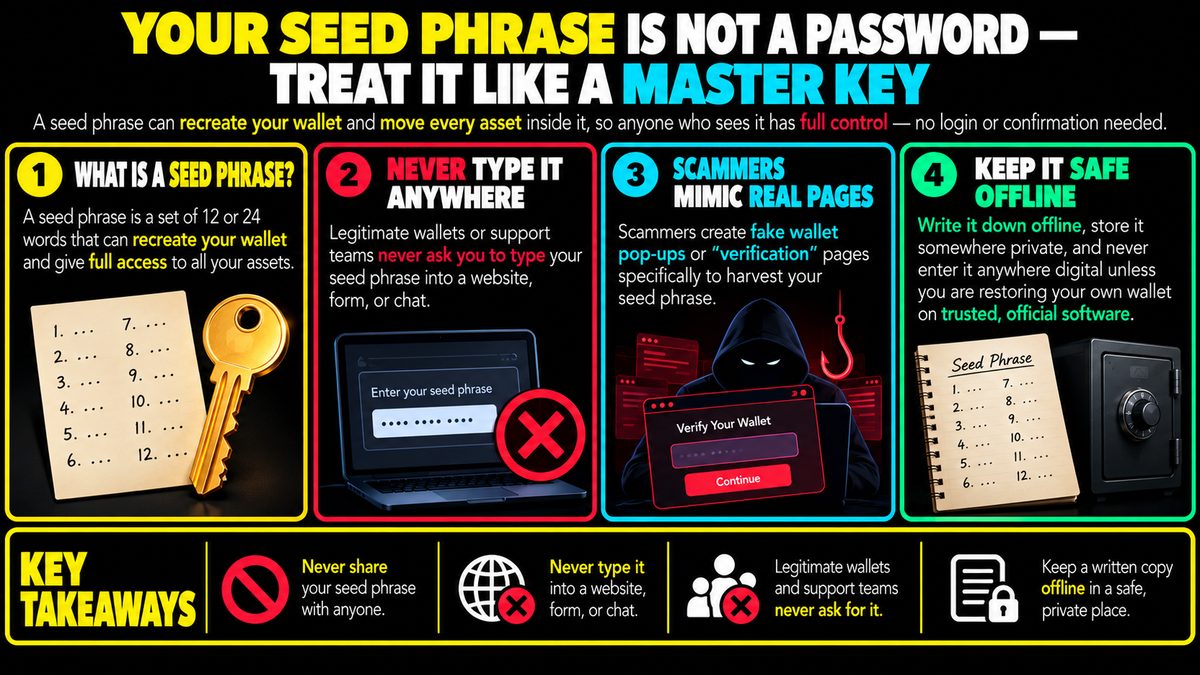
Seed Phrase vs Password: Why It's a Master Key
A seed phrase can recreate your wallet and move every asset inside it, so anyone who sees it has full control — no login or confirmation needed. Legitimate wallets or support…
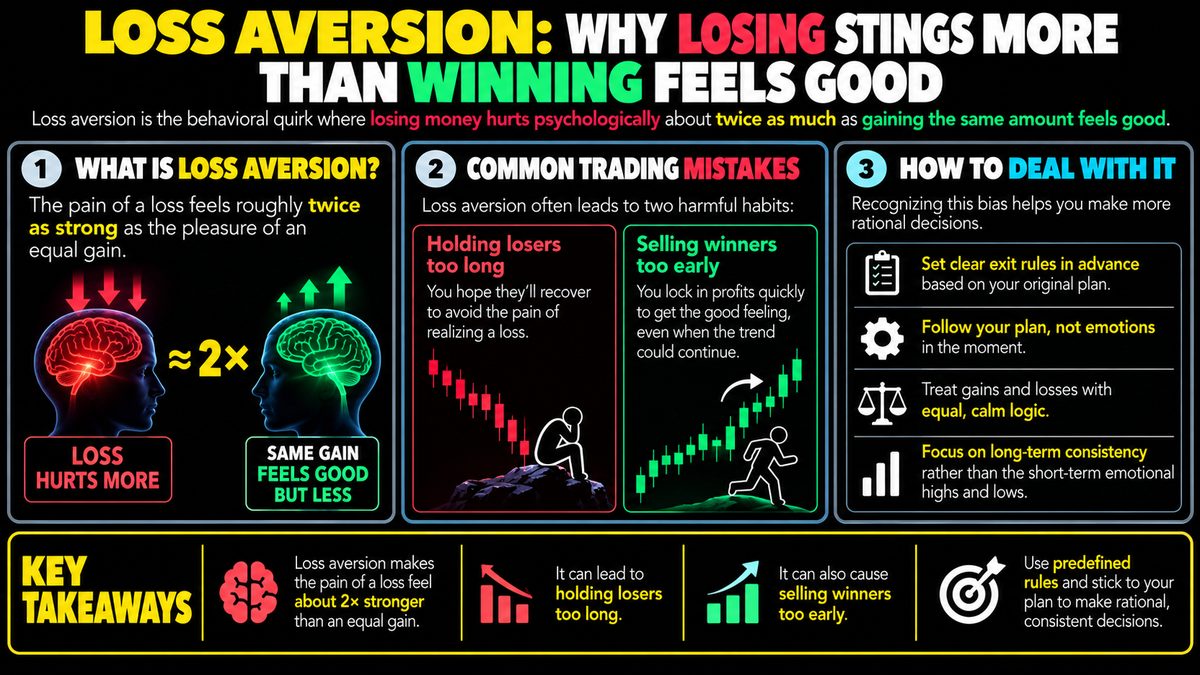
Loss Aversion in Trading: Why Losses Hurt More
Loss aversion is the behavioral quirk where losing money hurts psychologically about twice as much as gaining the same amount feels good. In trading, this often causes two bad…
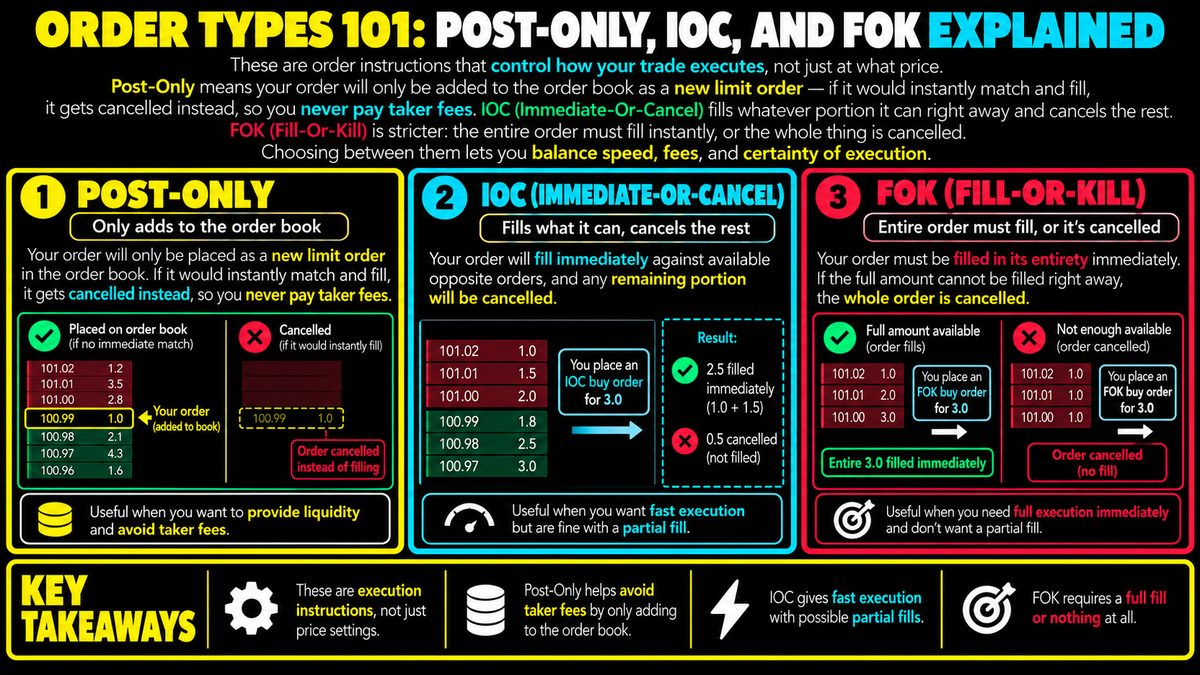
Post-Only, IOC, and FOK Order Types Explained
These are order instructions that control how your trade executes, not just at what price. Post-Only means your order will only be added to the order book as a new limit order —…
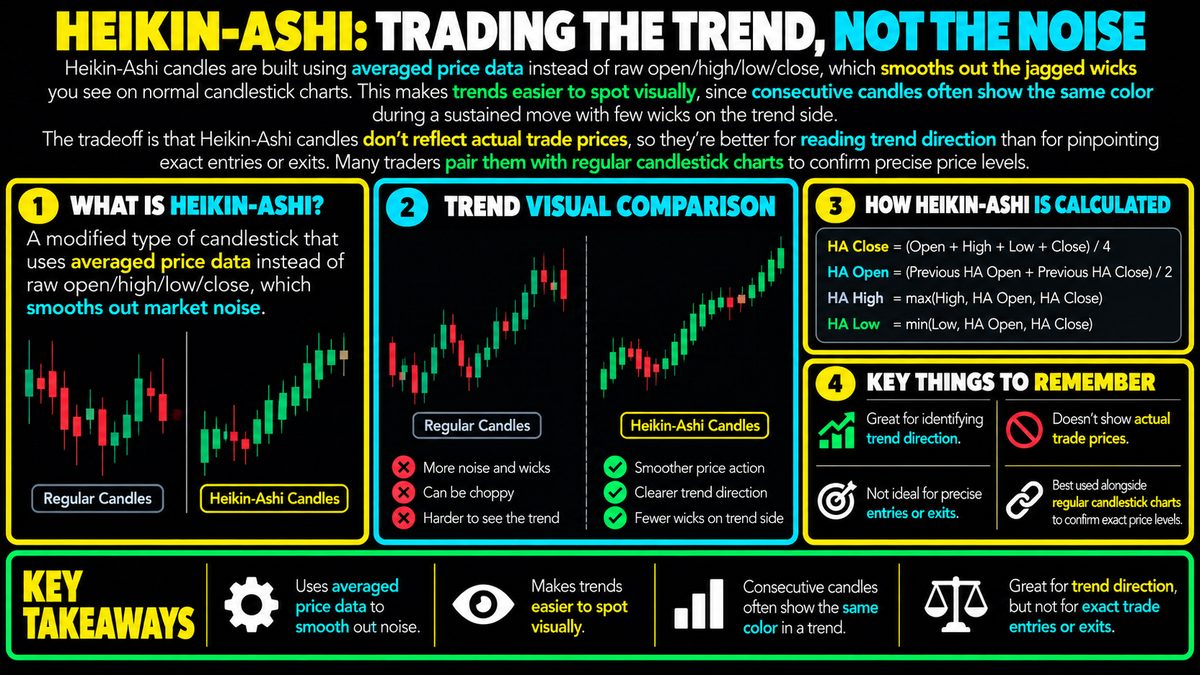
Heikin-Ashi Charts: How to Read Smoothed Price Trends
Heikin-Ashi candles are built using averaged price data instead of raw open/high/low/close, which smooths out the jagged wicks you see on normal candlestick charts. This makes…
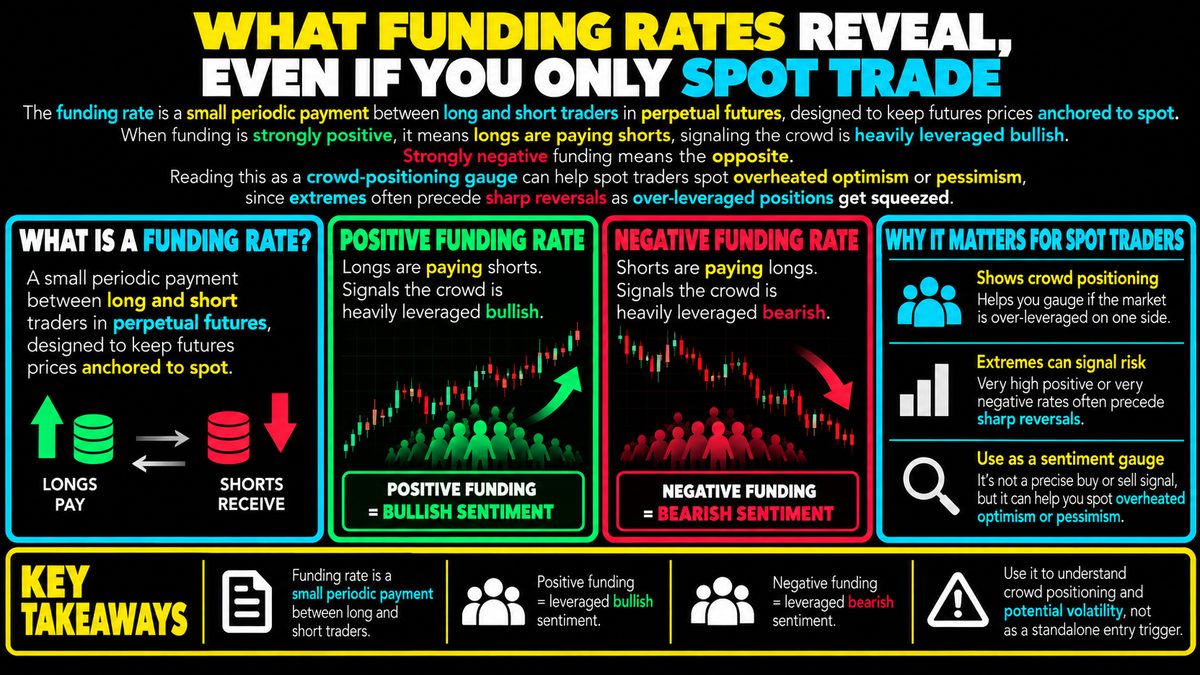
Funding Rate Meaning: Why Spot Traders Should Care
The funding rate is a small periodic payment between long and short traders in perpetual futures, designed to keep futures prices anchored to spot. When funding is strongly…
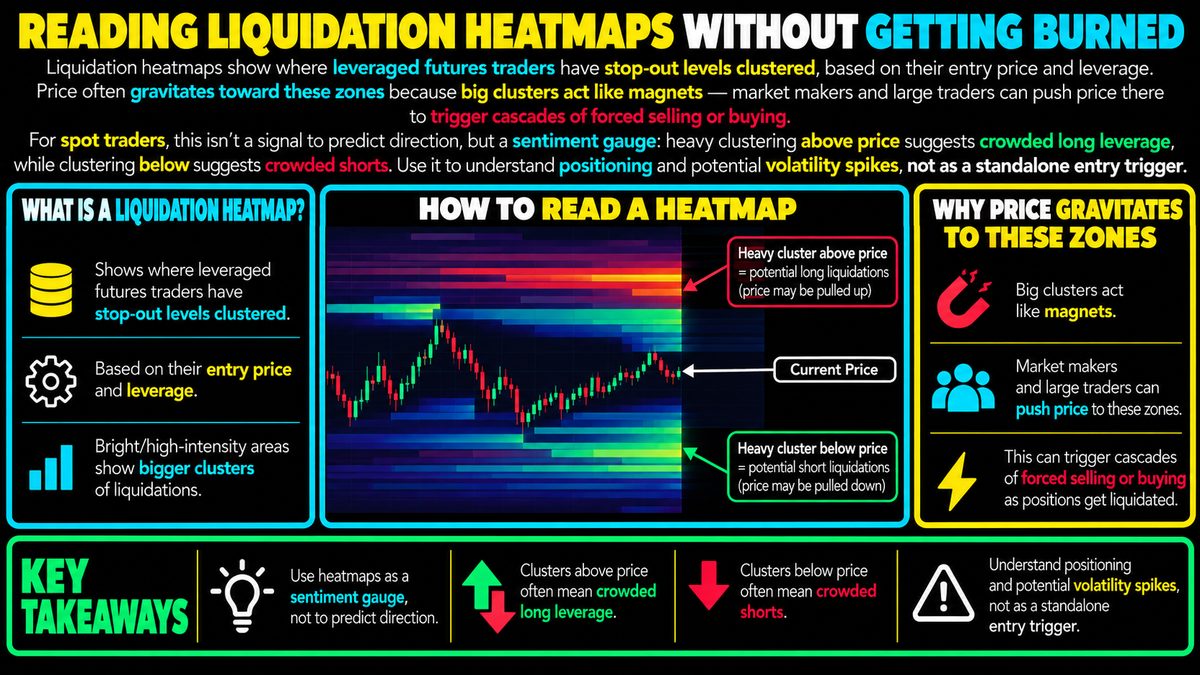
Liquidation Heatmaps: How To Read Them Safely
Liquidation heatmaps show where leveraged futures traders have stop-out levels clustered, based on their entry price and leverage. Price often gravitates toward these zones…
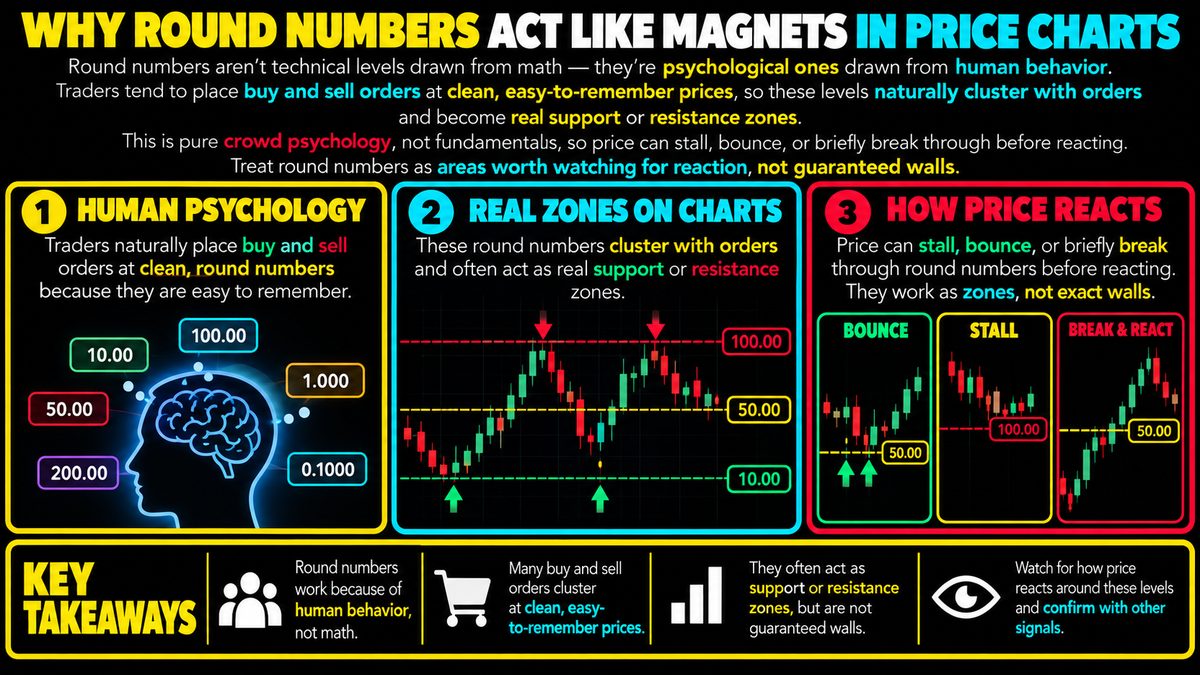
Round Numbers in Price Charts: Support and Resistance
Round numbers aren't technical levels drawn from math — they're psychological ones drawn from human behavior. Traders tend to place buy and sell orders at clean, easy-to-remember…
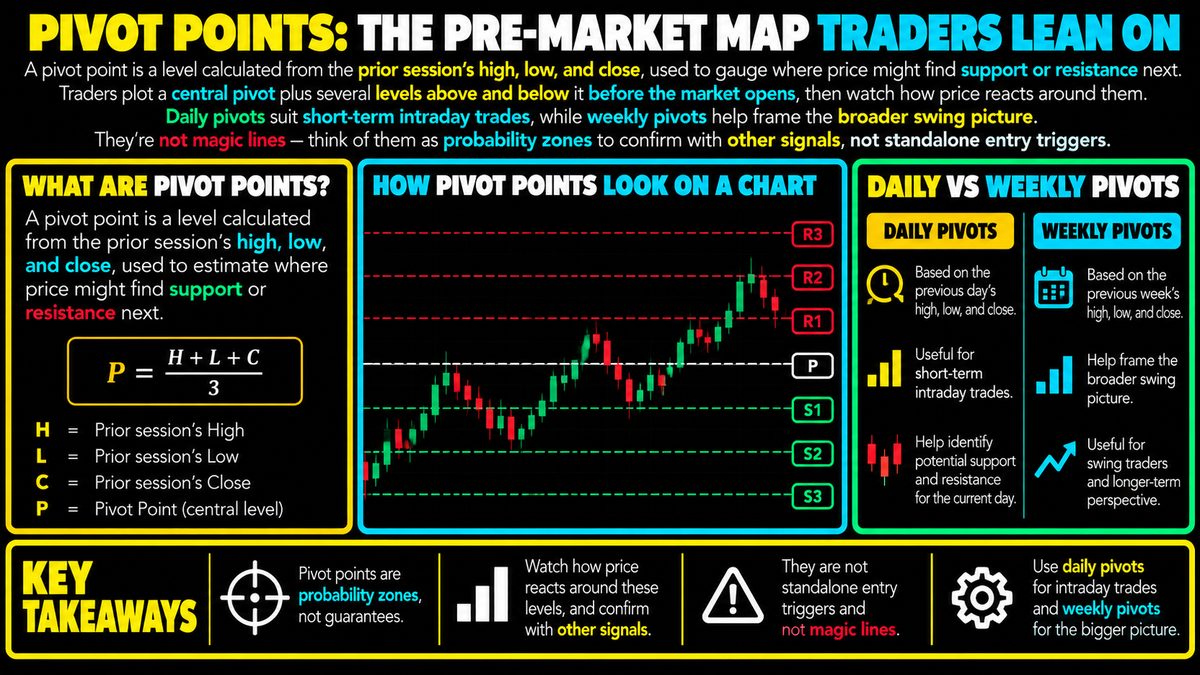
Pivot Points: How Traders Calculate Support and Resistance
A pivot point is a level calculated from the prior session's high, low, and close, used to gauge where price might find support or resistance next. Traders plot a central pivot…
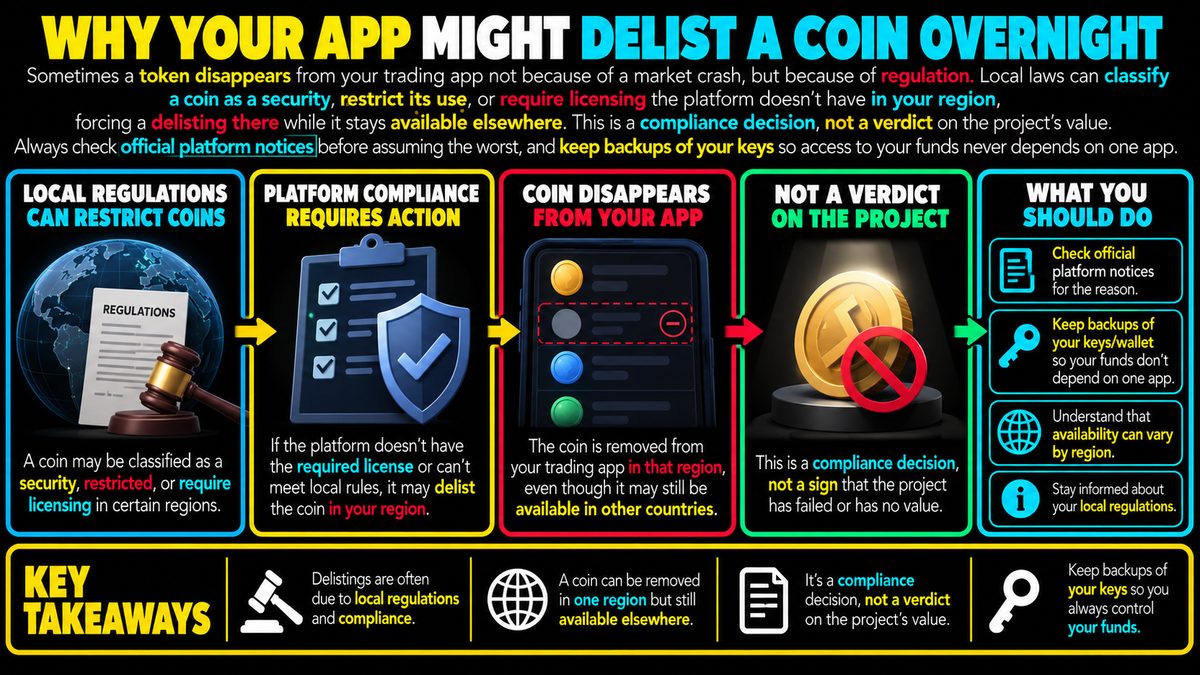
Crypto Coin Delisting: What It Means and How to Respond
Sometimes a token disappears from your trading app not because of a market crash, but because of regulation. Local laws can classify a coin as a security, restrict its use, or…
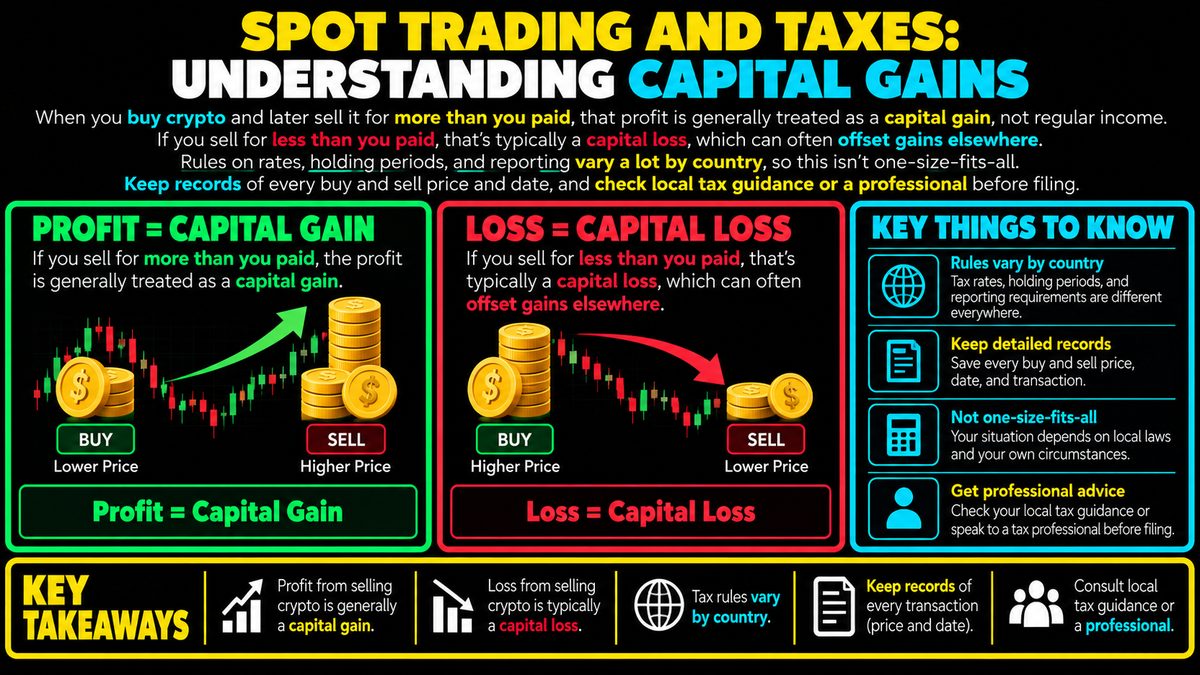
Spot Trading and Taxes: Capital Gains Explained
When you buy crypto and later sell it for more than you paid, that profit is generally treated as a capital gain, not regular income. If you sell for less than you paid, that's…
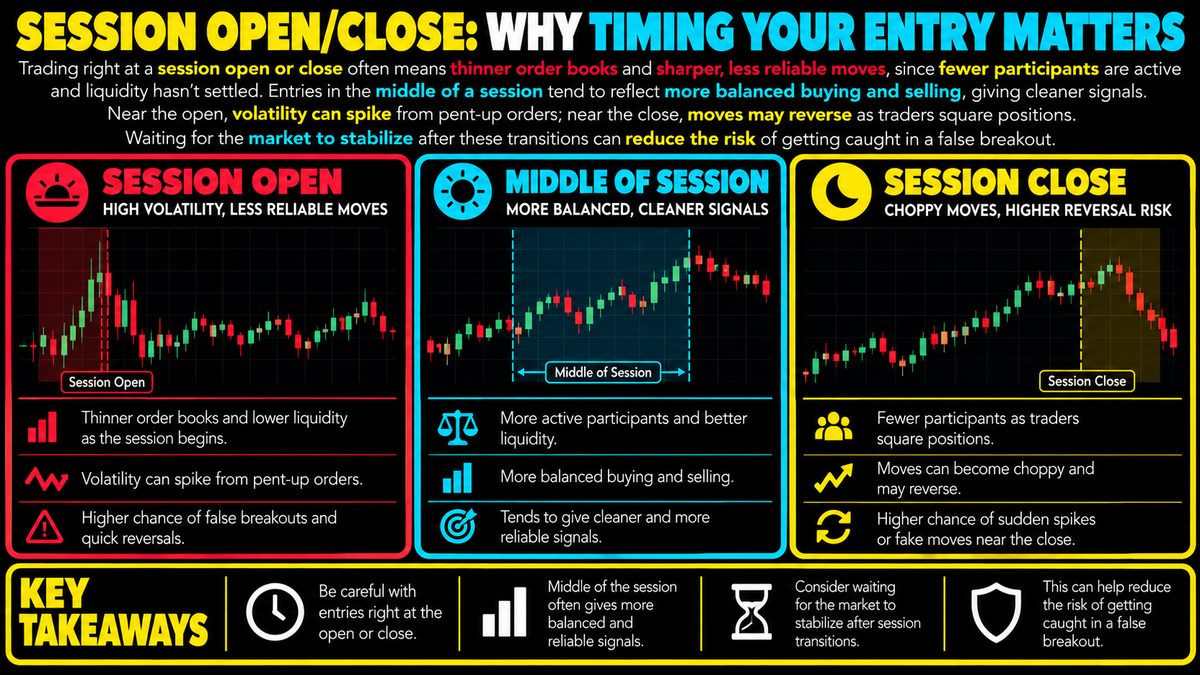
Session Open/Close: Crypto Trading Timing Risk
Trading right at a session open or close often means thinner order books and sharper, less reliable moves, since fewer participants are active and liquidity hasn't settled.…
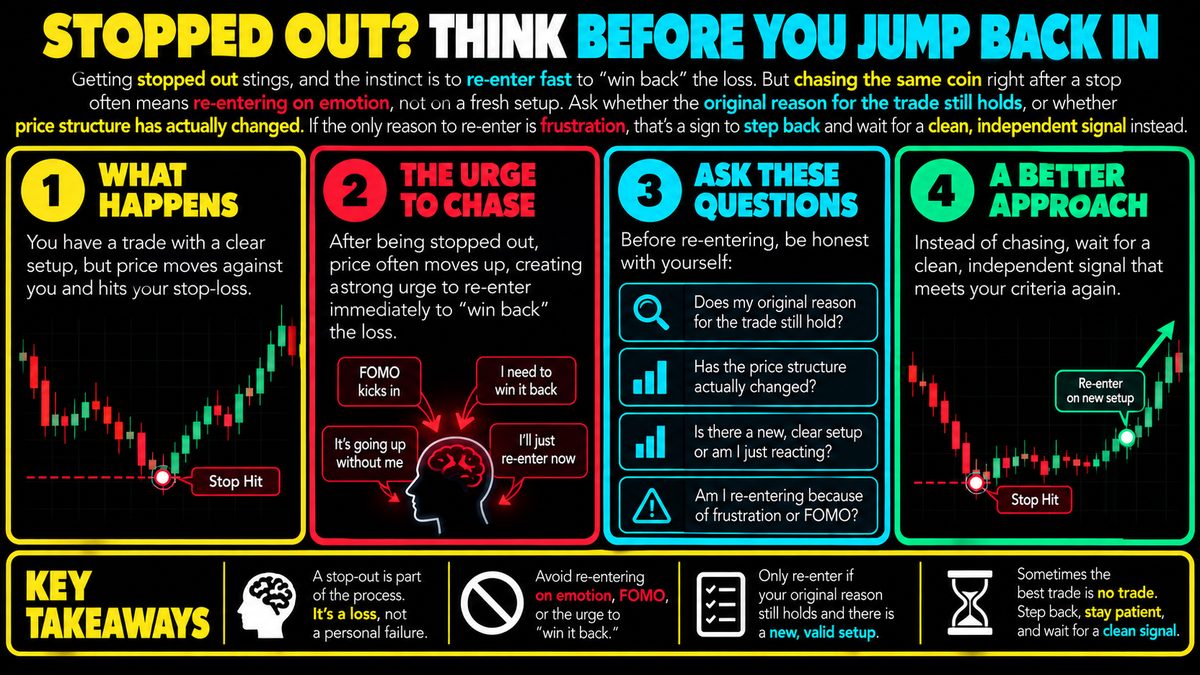
Stop Loss Hit: Don't Chase With Revenge Trades
Getting stopped out stings, and the instinct is to re-enter fast to "win back" the loss. But chasing the same coin right after a stop often means re-entering on emotion, not on a…
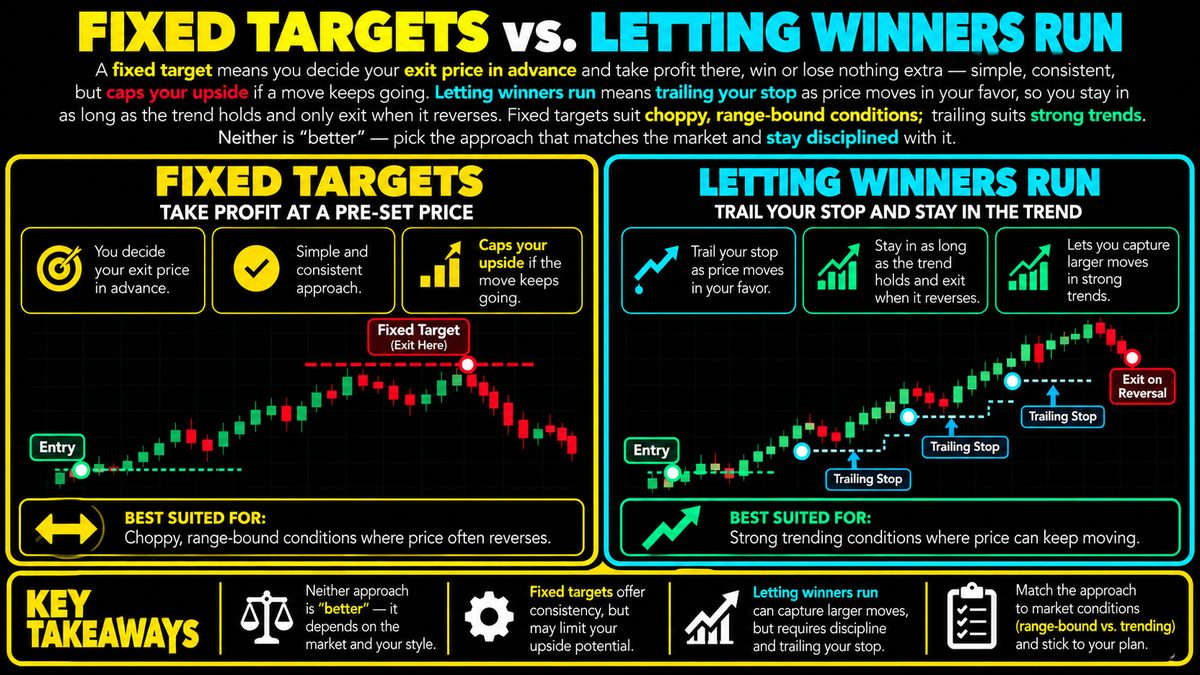
Fixed Targets vs Trailing Stops: Exit Strategies
A fixed target means you decide your exit price in advance and take profit there, win or lose nothing extra — simple, consistent, but caps your upside if a move keeps going.…
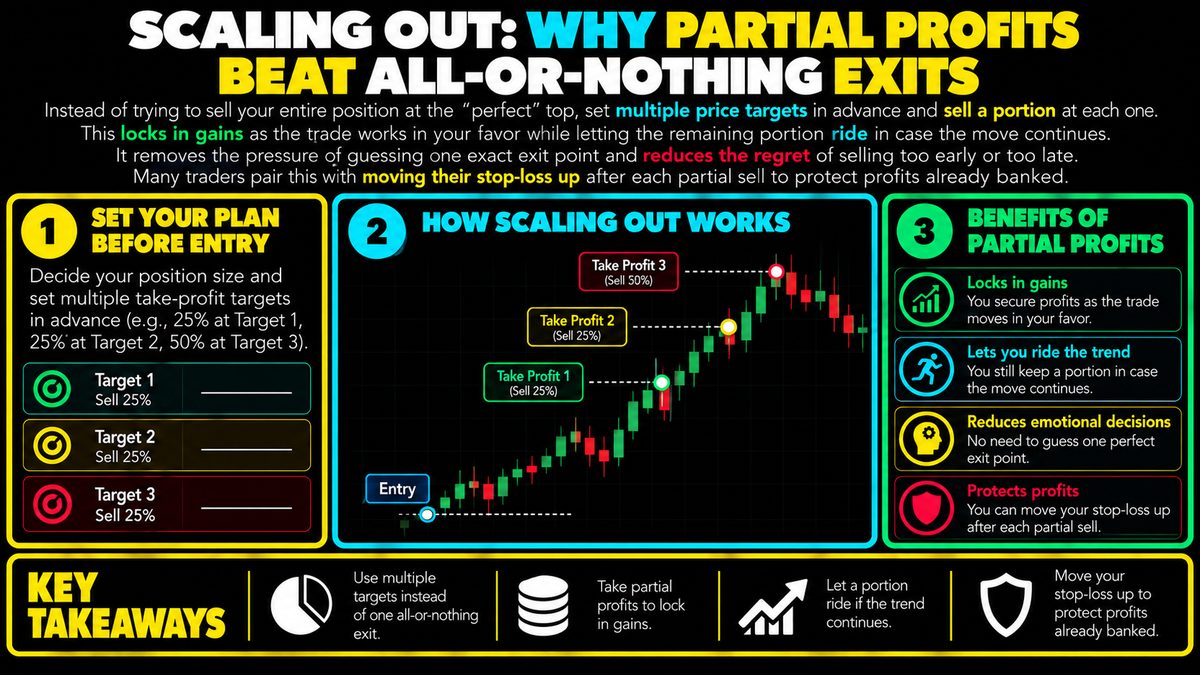
Scaling Out Strategy: Exit in Stages for Better Profits
Instead of trying to sell your entire position at the "perfect" top, set multiple price targets in advance and sell a portion at each one. This locks in gains as the trade works…
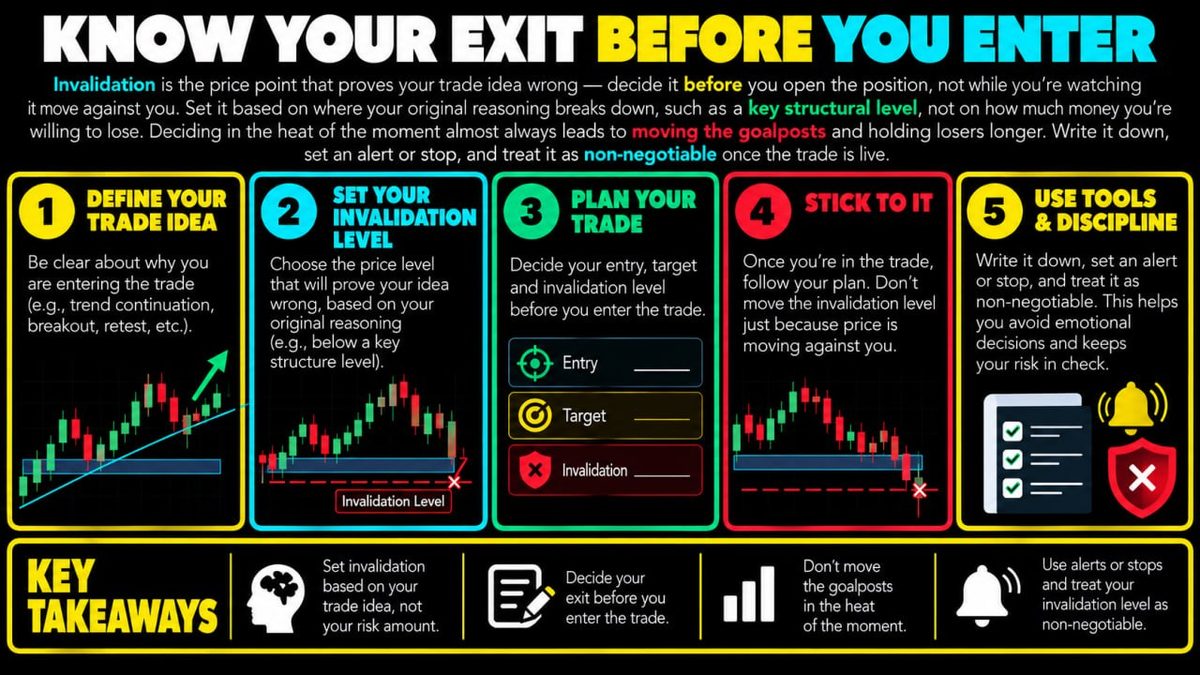
Trade Invalidation: Setting Your Exit Before Entry
Invalidation is the price point that proves your trade idea wrong — decide it before you open the position, not while you're watching it move against you. Set it based on where…
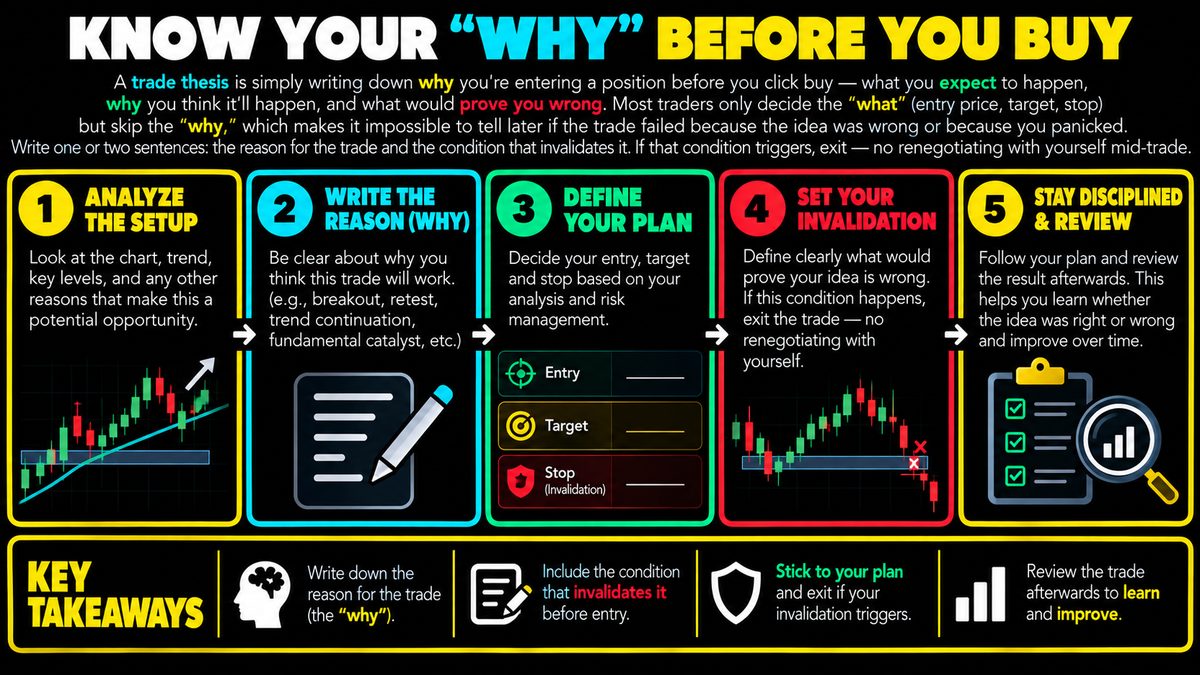
Trade Thesis: Why You Need Written Entry Reasoning
A trade thesis is simply writing down why you're entering a position before you click buy — what you expect to happen, why you think it'll happen, and what would prove you wrong.…
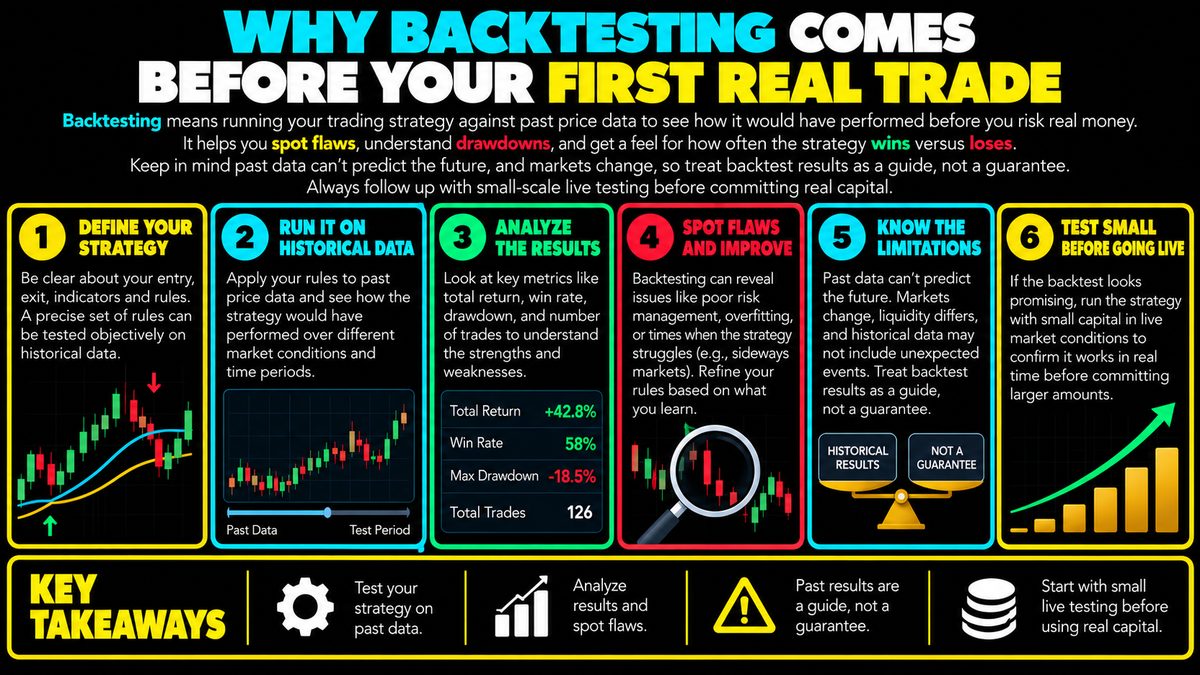
Backtesting: Why Test Before Trading Real Money
Backtesting means running your trading strategy against past price data to see how it would have performed before you risk real money. It helps you spot flaws, understand…
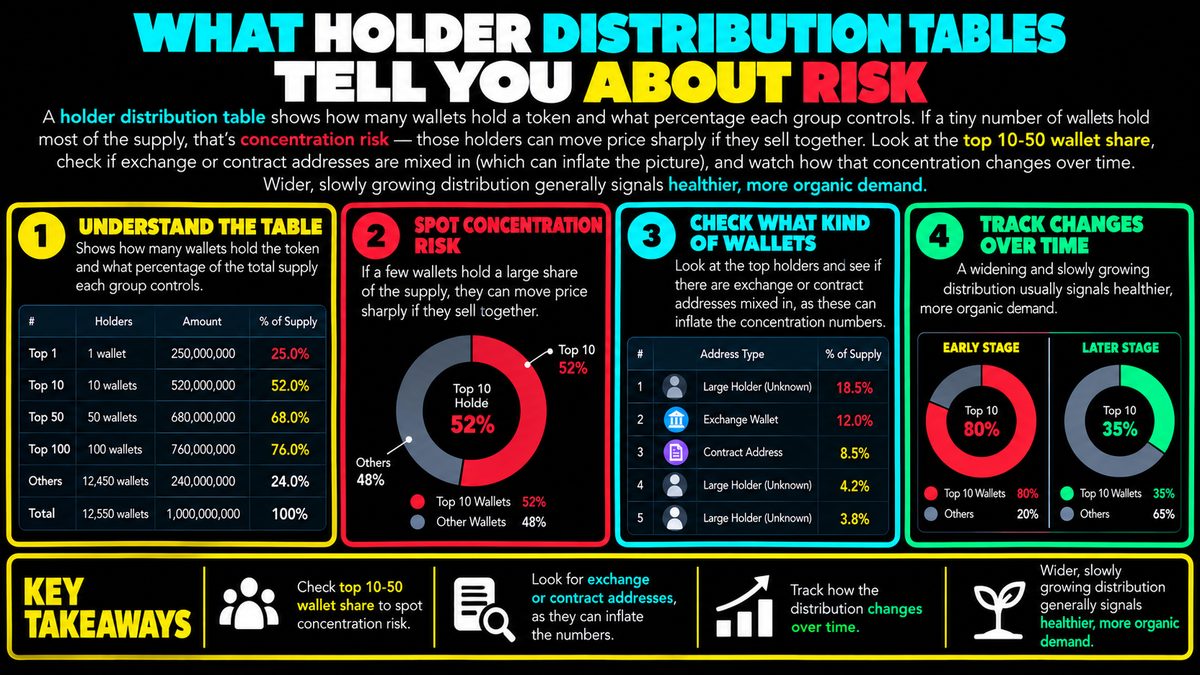
Holder Distribution Table: What It Reveals About Risk
A holder distribution table shows how many wallets hold a token and what percentage each group controls. If a tiny number of wallets hold most of the supply, that's concentration…
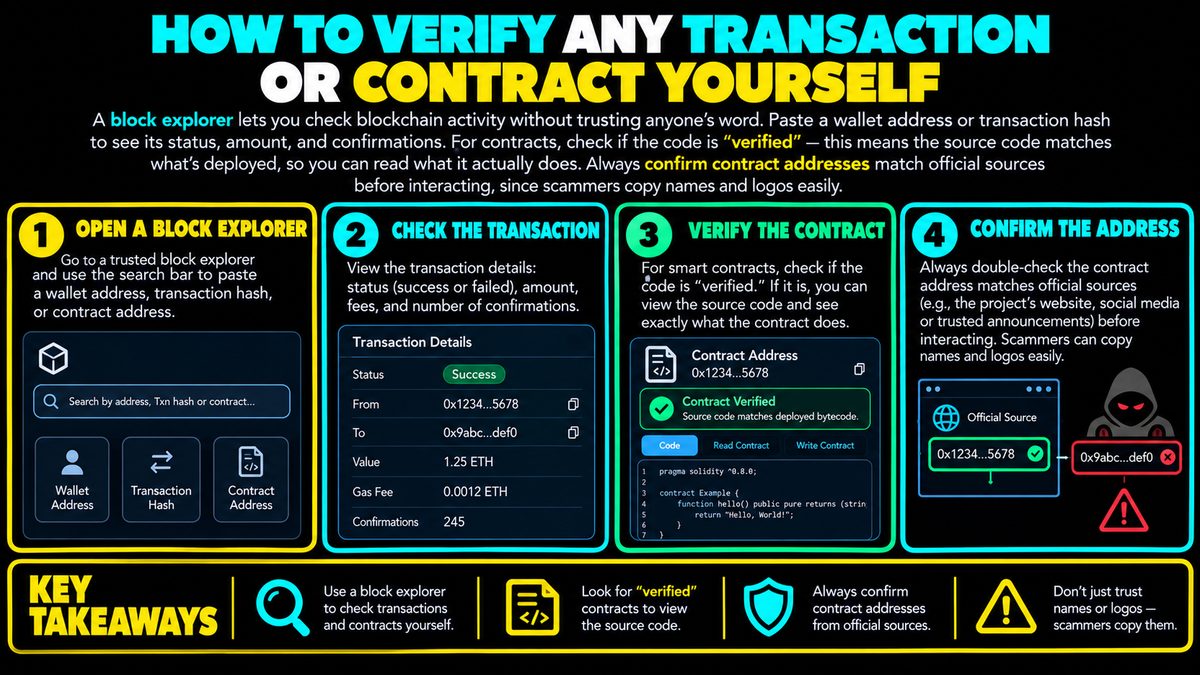
How to Use Block Explorers to Verify Transactions
A block explorer lets you check blockchain activity without trusting anyone's word. Paste a wallet address or transaction hash to see its status, amount, and confirmations. For…
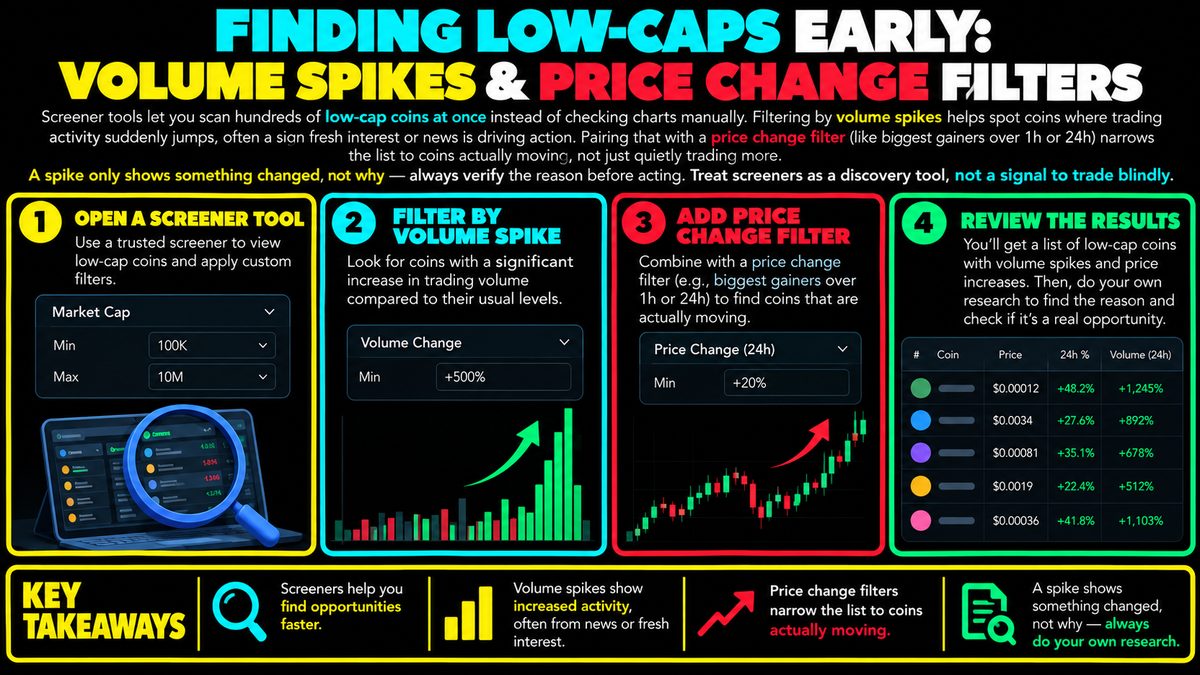
Low-Cap Screeners: Volume Spikes and Price Filters
Screener tools let you scan hundreds of low-cap coins at once instead of checking charts manually. Filtering by volume spikes helps spot coins where trading activity suddenly…
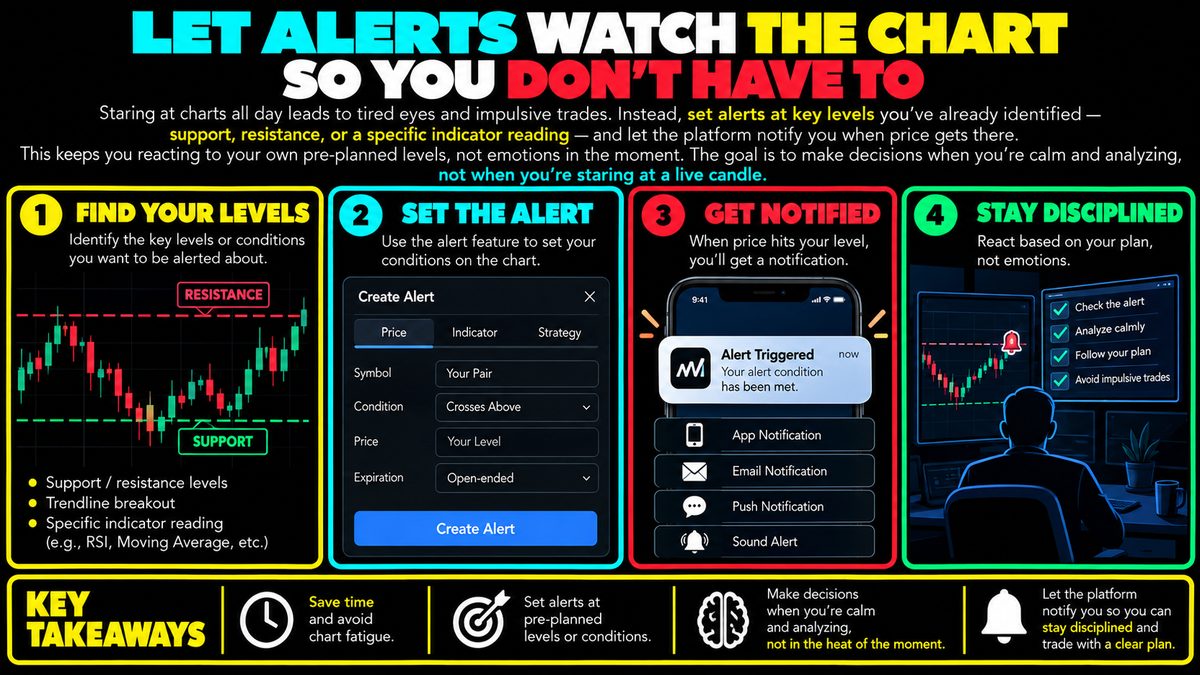
Price Alerts: Why They Beat Constant Chart Watching
Staring at charts all day leads to tired eyes and impulsive trades. Instead, set alerts at key levels you've already identified — support, resistance, or a specific indicator…
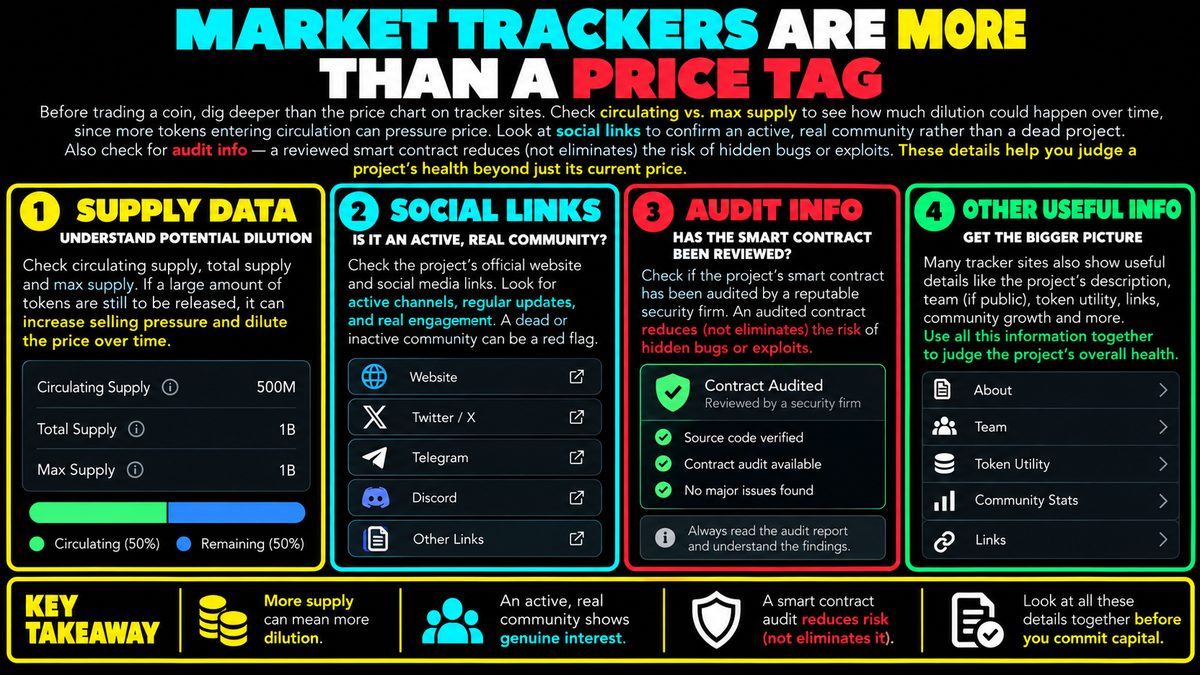
Market Tracker Metrics Beyond Price Charts
Before trading a coin, dig deeper than the price chart on tracker sites. Check circulating vs. max supply to see how much dilution could happen over time, since more tokens…
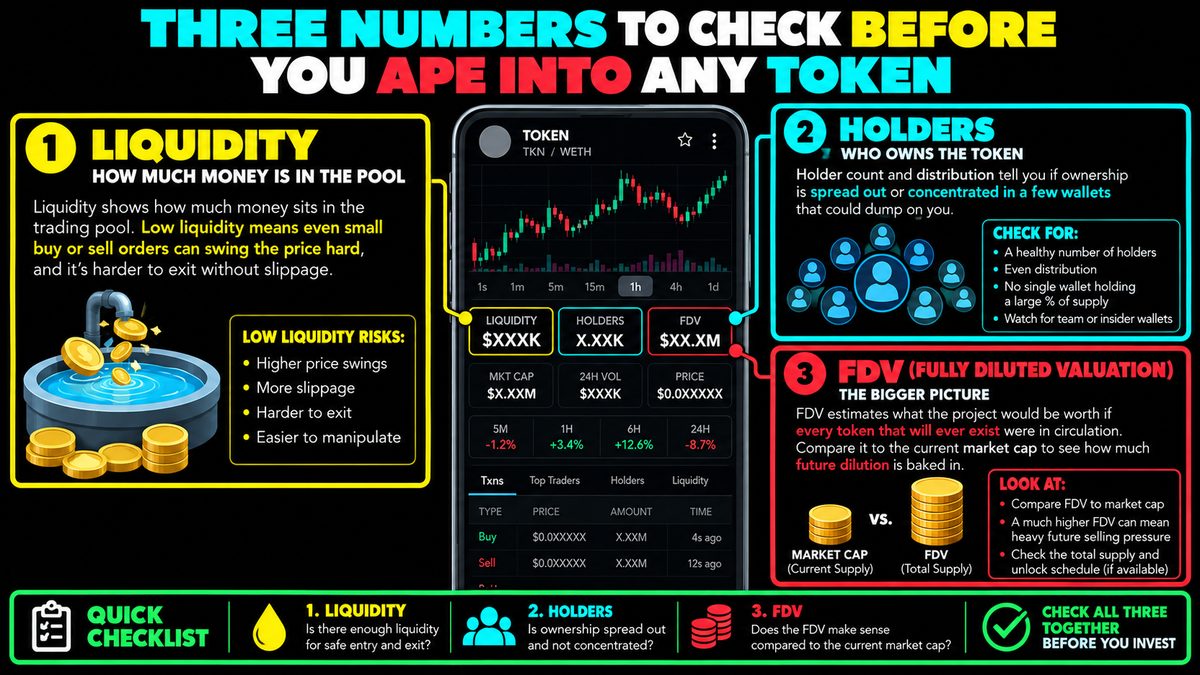
Three Numbers to Check Before Buying Any Token
Liquidity shows how much money sits in the trading pool — low liquidity means even small buy or sell orders can swing the price hard, and it's harder to exit without slippage.…
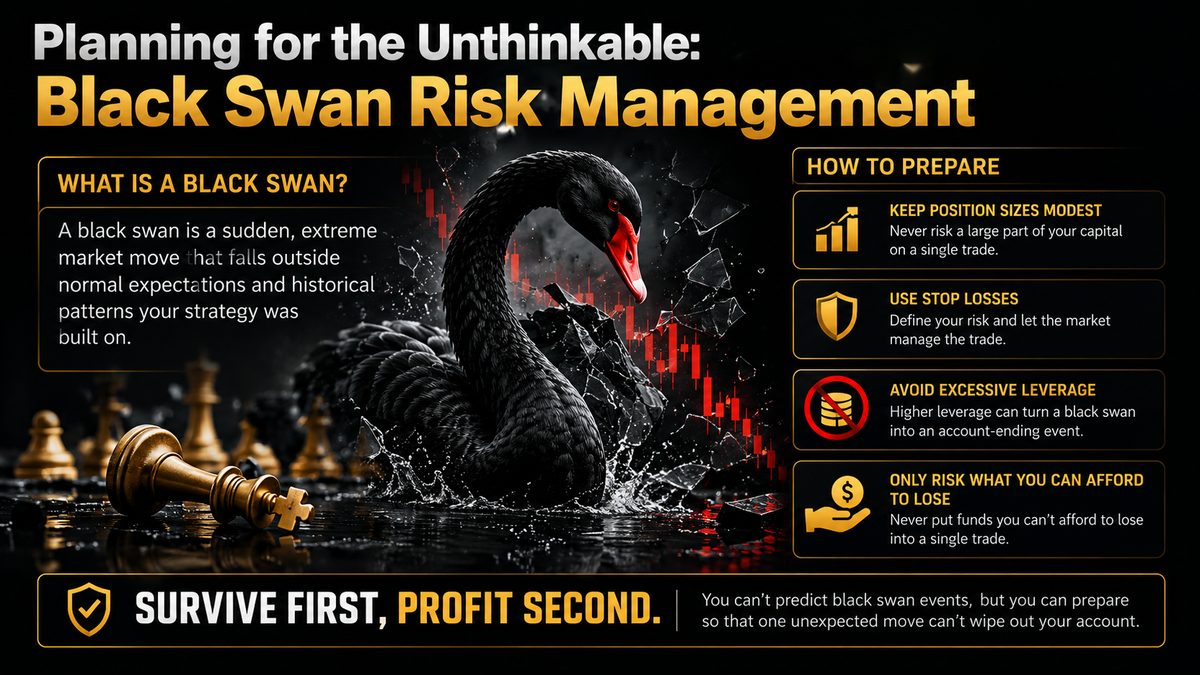
Black Swan Events in Crypto: Risk Management Guide
A black swan is a sudden, extreme market move that falls outside normal expectations and historical patterns your strategy was built on. You can't predict these events, but you…
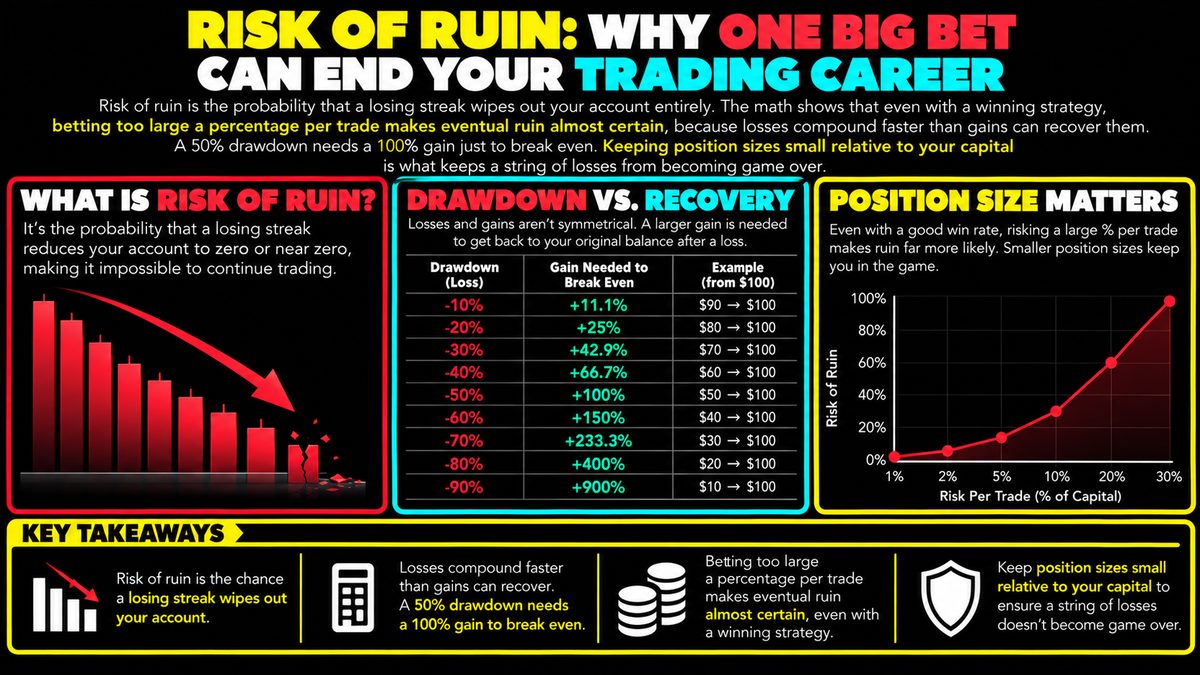
Risk of Ruin in Trading: Position Size and Account Survival
Risk of ruin is the probability that a losing streak wipes out your account entirely. The math shows that even with a winning strategy, betting too large a percentage per trade…
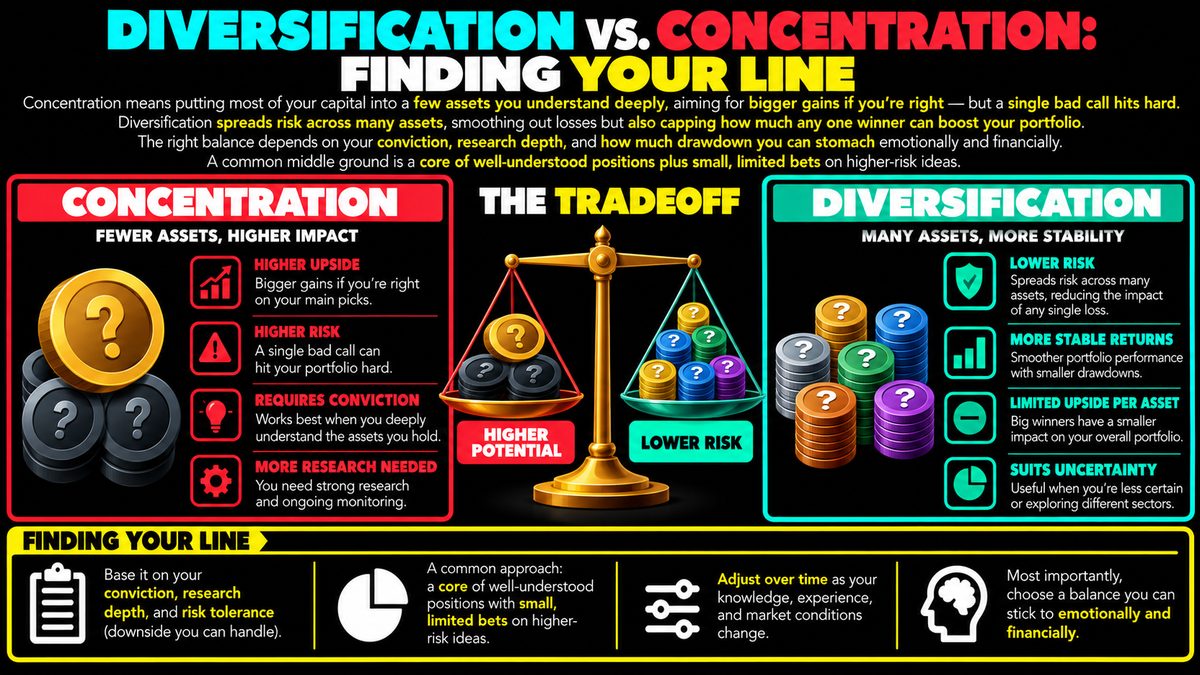
Crypto Portfolio: Concentration vs Diversification Balance
Concentration means putting most of your capital into a few assets you understand deeply, aiming for bigger gains if you're right — but a single bad call hits hard.…
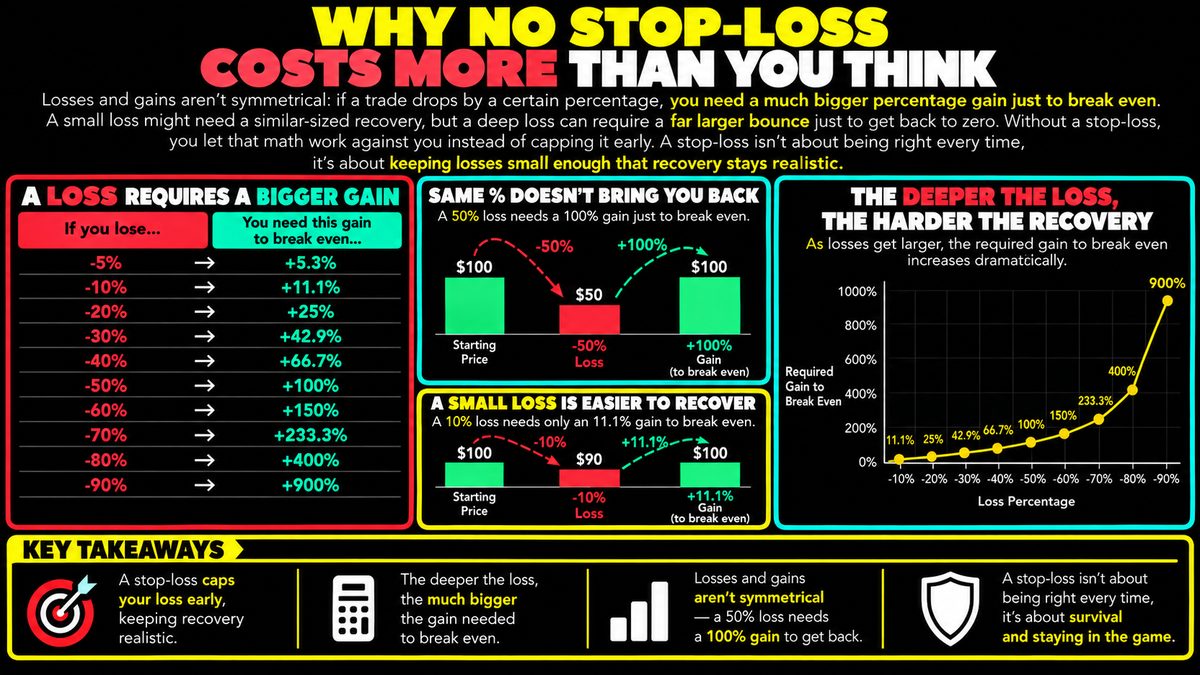
Stop-Loss Math: Why Skipping It Costs More
Losses and gains aren't symmetrical: if a trade drops by a certain percentage, you need a much bigger percentage gain just to break even. A small loss might need a similar-sized…
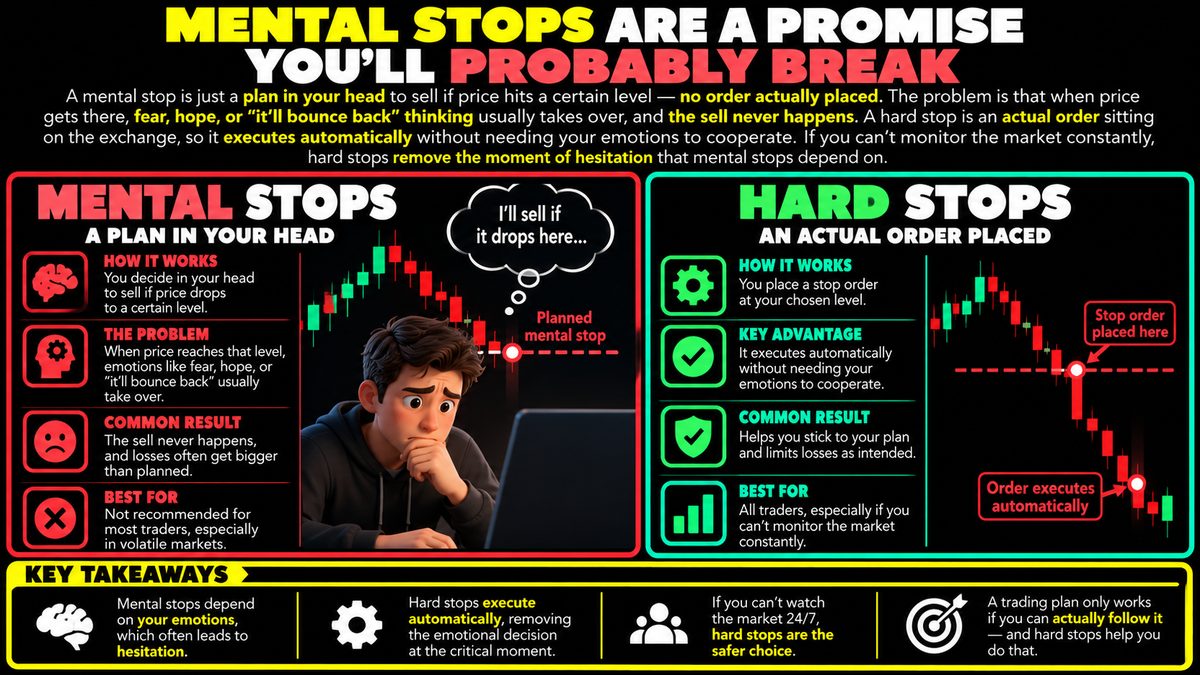
Mental Stops vs Hard Stops: Which Actually Works
A mental stop is just a plan in your head to sell if price hits a certain level — no order actually placed. The problem is that when price gets there, fear, hope, or "it'll bounce…
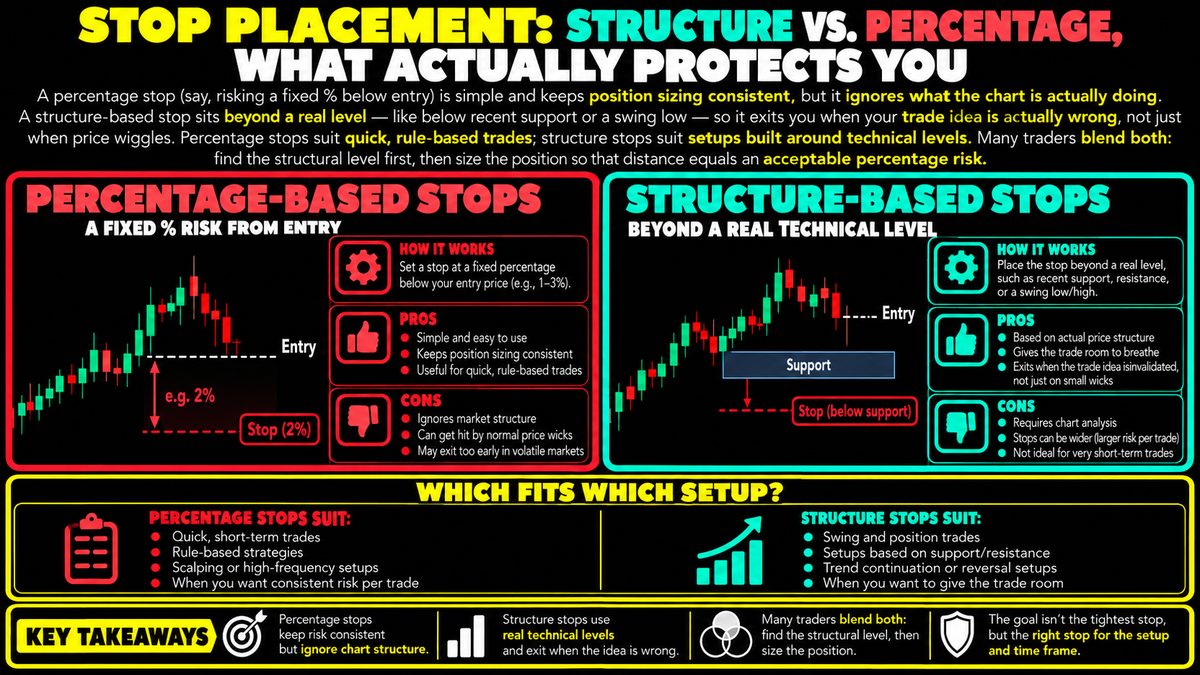
Stop-Loss Placement: Structure vs Percentage Methods
A percentage stop (say, risking a fixed % below entry) is simple and keeps position sizing consistent, but it ignores what the chart is actually doing. A structure-based stop sits…
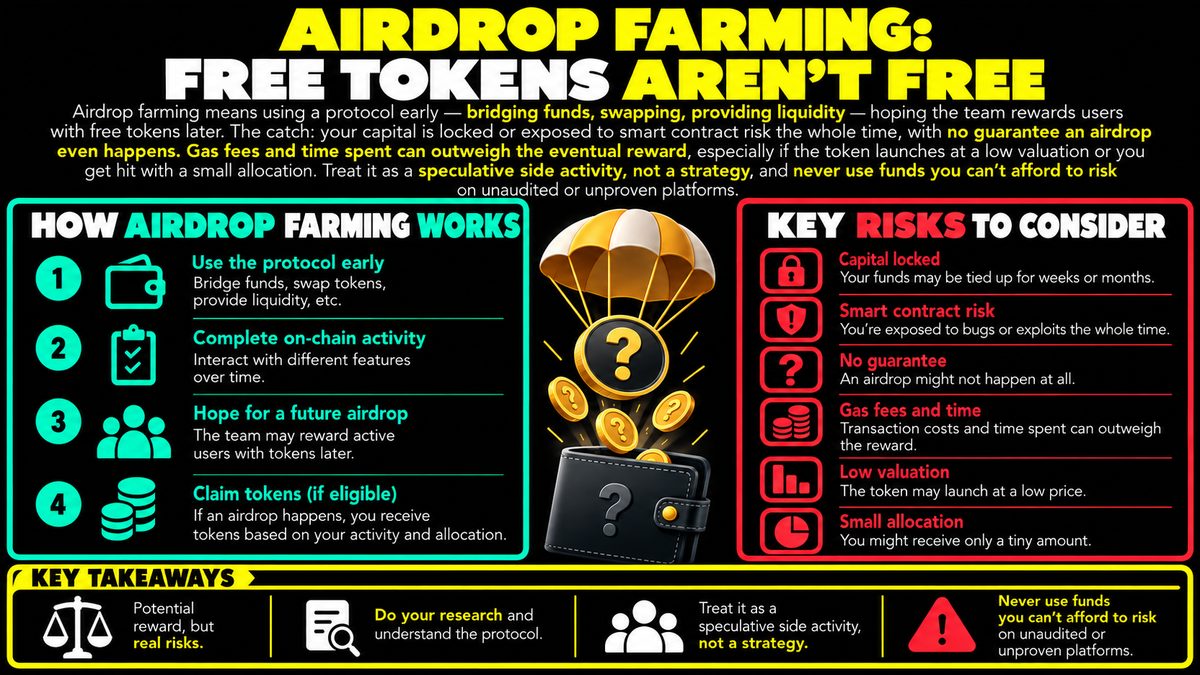
Airdrop Farming: Hidden Costs and Risks of Free Tokens
Airdrop farming means using a protocol early — bridging funds, swapping, providing liquidity — hoping the team rewards users with free tokens later. The catch: your capital is…
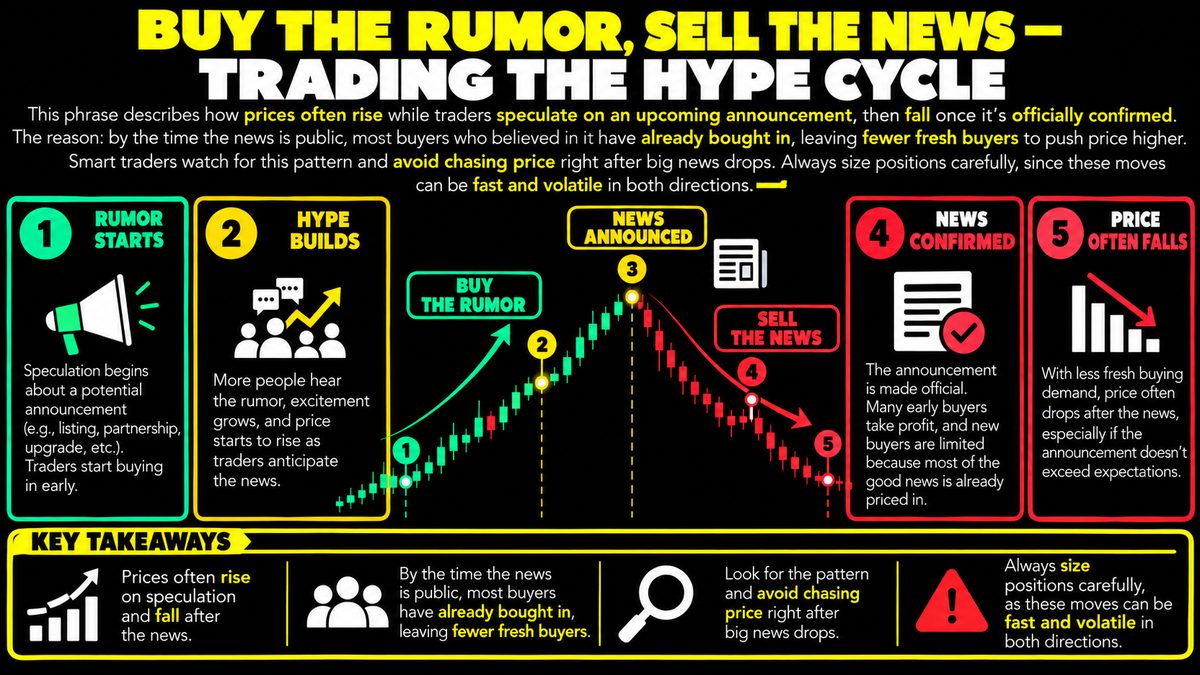
Buy the Rumor, Sell the News: What It Means in Crypto Trading
This phrase describes how prices often rise while traders speculate on an upcoming announcement, then fall once it's officially confirmed. The reason: by the time the news is…
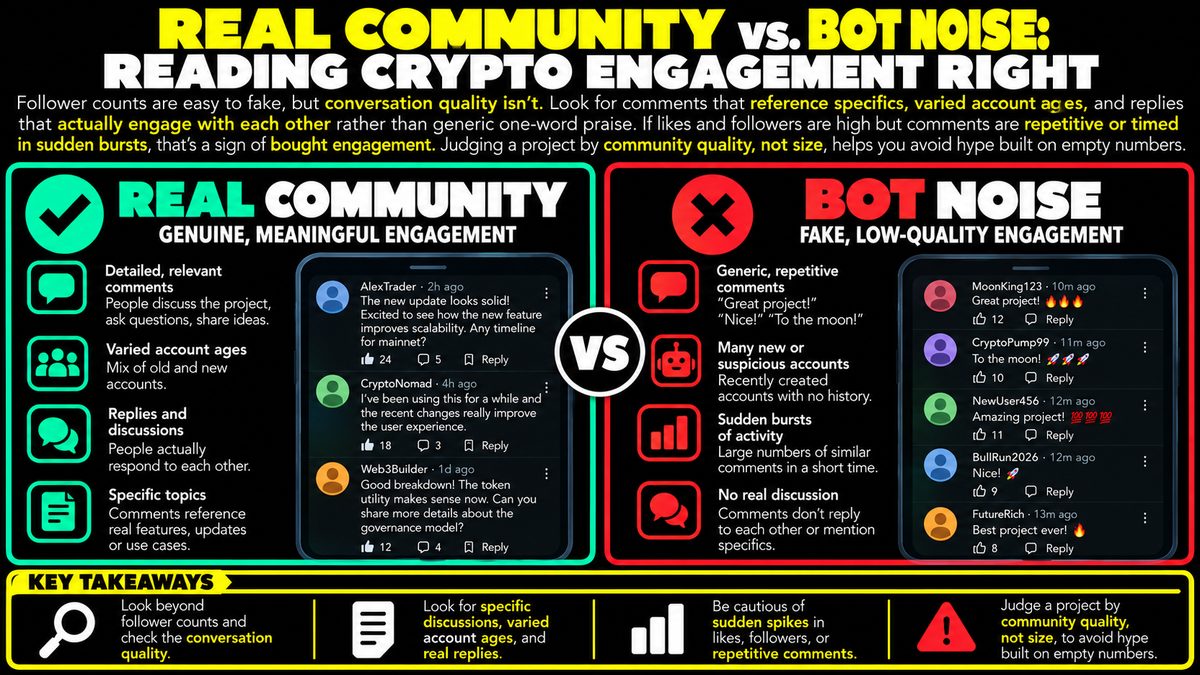
How to Spot Bot Engagement vs Real Crypto Community
Follower counts are easy to fake, but conversation quality isn't. Look for comments that reference specifics, varied account ages, and replies that actually engage with each other…
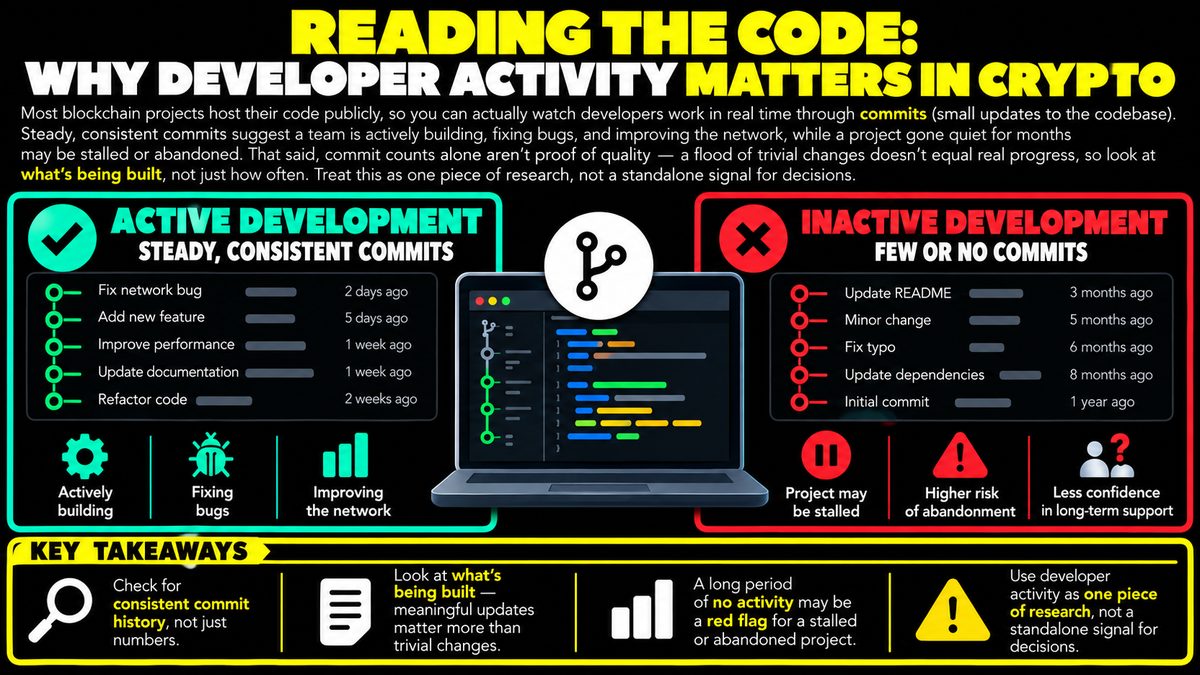
Developer Activity in Crypto: Why It Matters and What It Shows
Most blockchain projects host their code publicly, so you can actually watch developers work in real time through commits (small updates to the codebase). Steady, consistent…
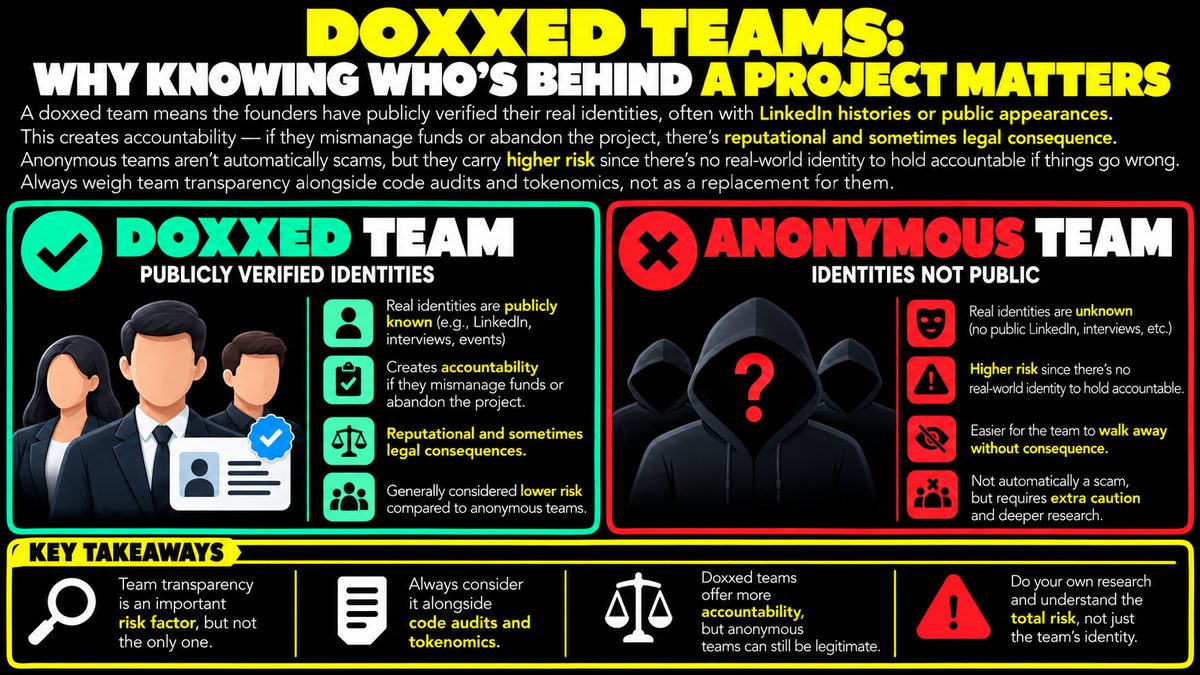
Doxxed Crypto Teams: Why Knowing the Founders Matters
A doxxed team means the founders have publicly verified their real identities, often with LinkedIn histories or public appearances. This creates accountability — if they mismanage…
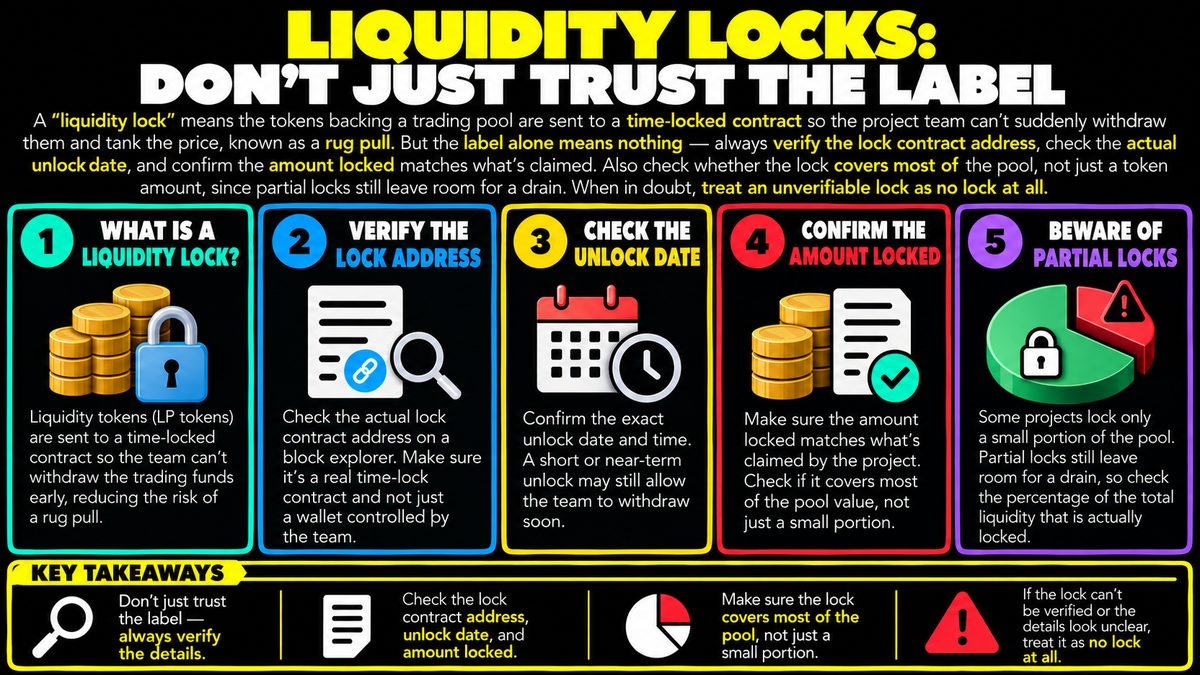
Liquidity Locks: How to Verify Them Before Trusting a Token
A "liquidity lock" means the tokens backing a trading pool are sent to a time-locked contract so the project team can't suddenly withdraw them and tank the price, known as a rug…
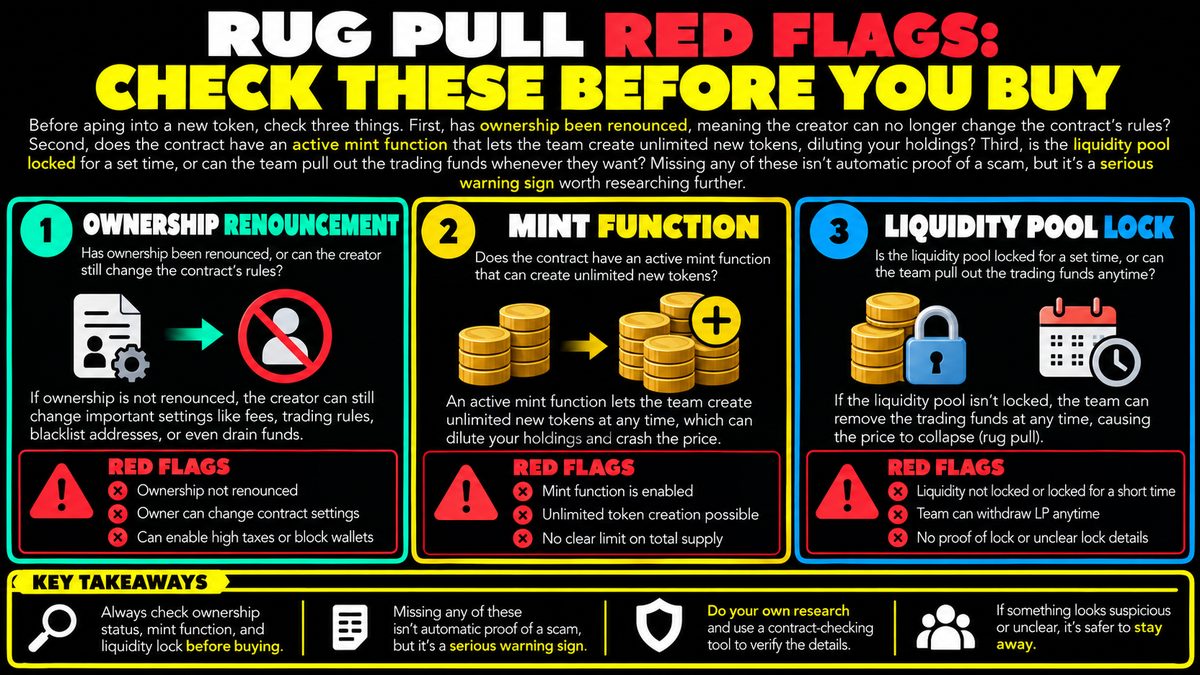
Rug Pull Red Flags: Ownership, Mint Function, Liquidity Locks
Before aping into a new token, check three things. First, has ownership been renounced, meaning the creator can no longer change the contract's rules? Second, does the contract…
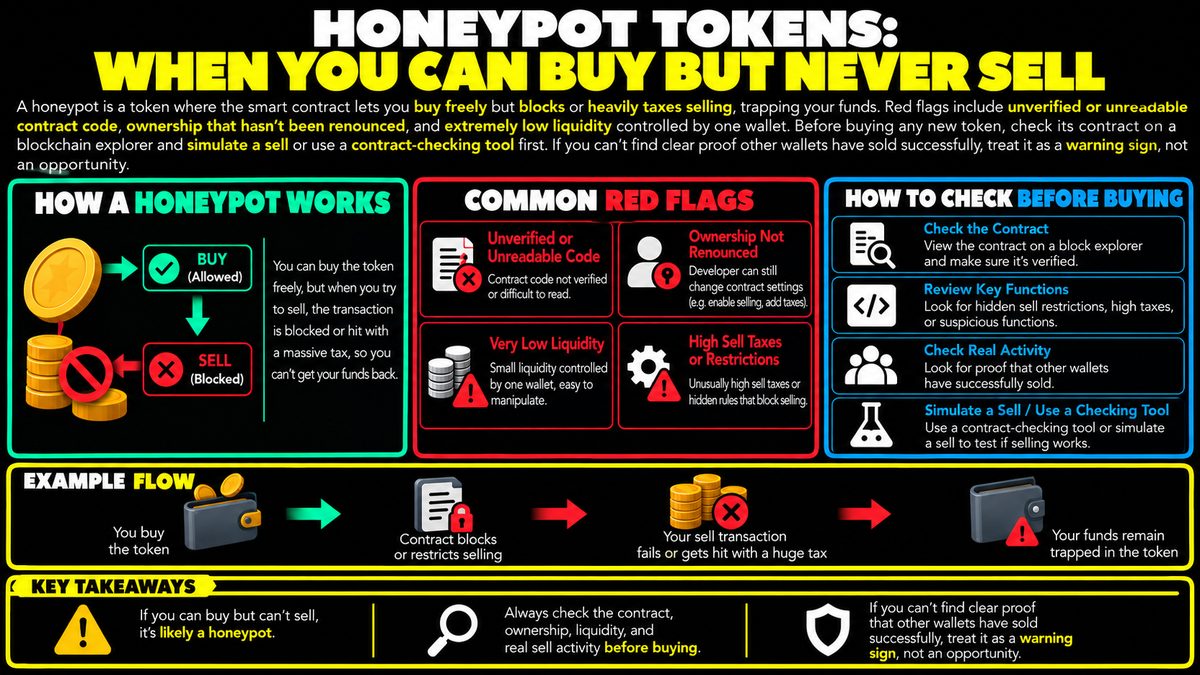
Honeypot Crypto Scam: How It Works and Warning Signs
A honeypot is a token where the smart contract lets you buy freely but blocks or heavily taxes selling, trapping your funds. Red flags include unverified or unreadable contract…
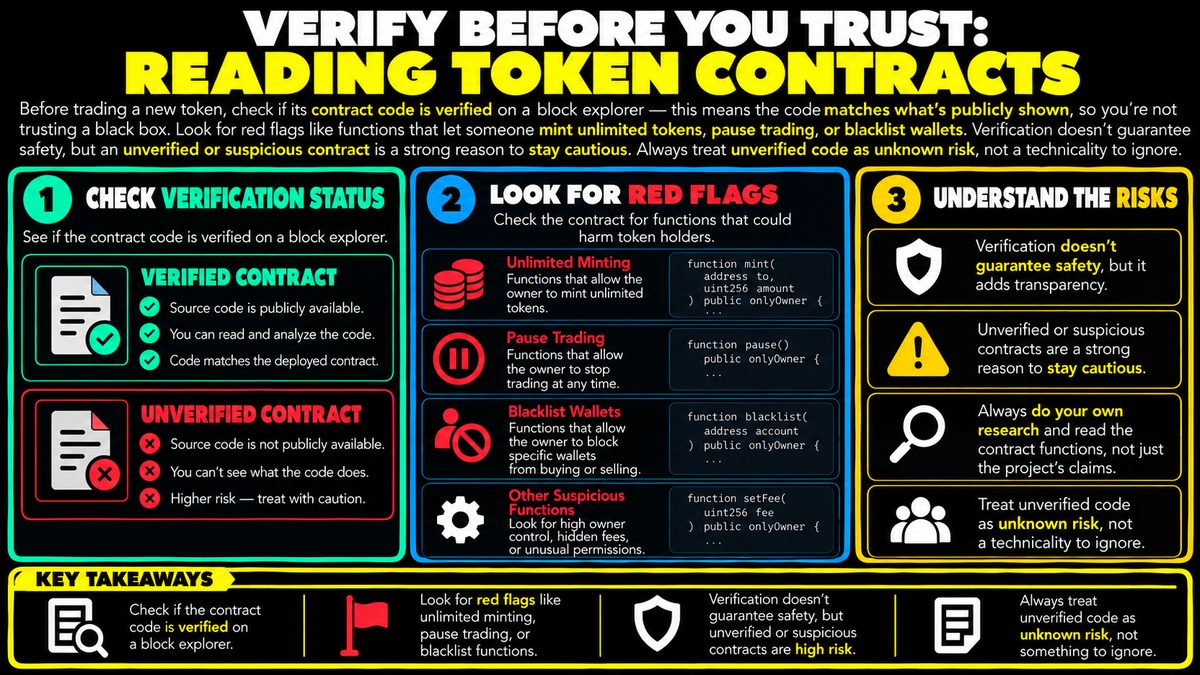
How to Verify and Read a Token Smart Contract
Before trading a new token, check if its contract code is verified on a block explorer — this means the code matches what's publicly shown, so you're not trusting a black box.…
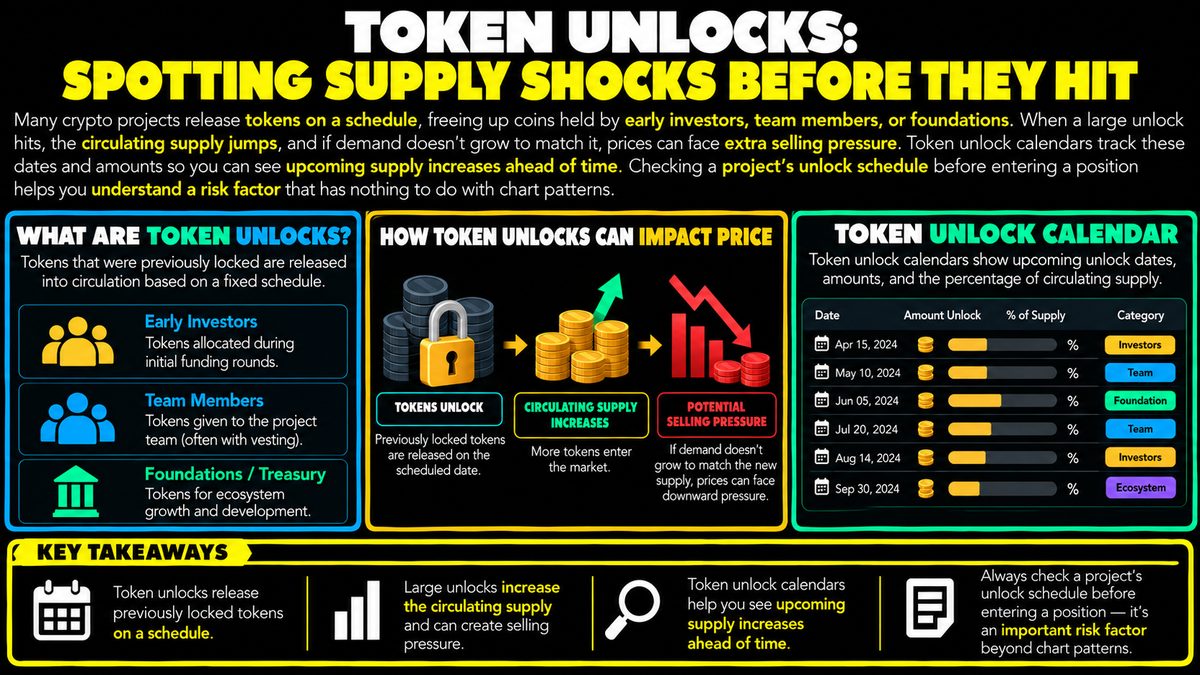
Token Unlocks: How Scheduled Supply Shocks Move Crypto Prices
Many crypto projects release tokens on a schedule, freeing up coins held by early investors, team members, or foundations. When a large unlock hits, the circulating supply jumps,…
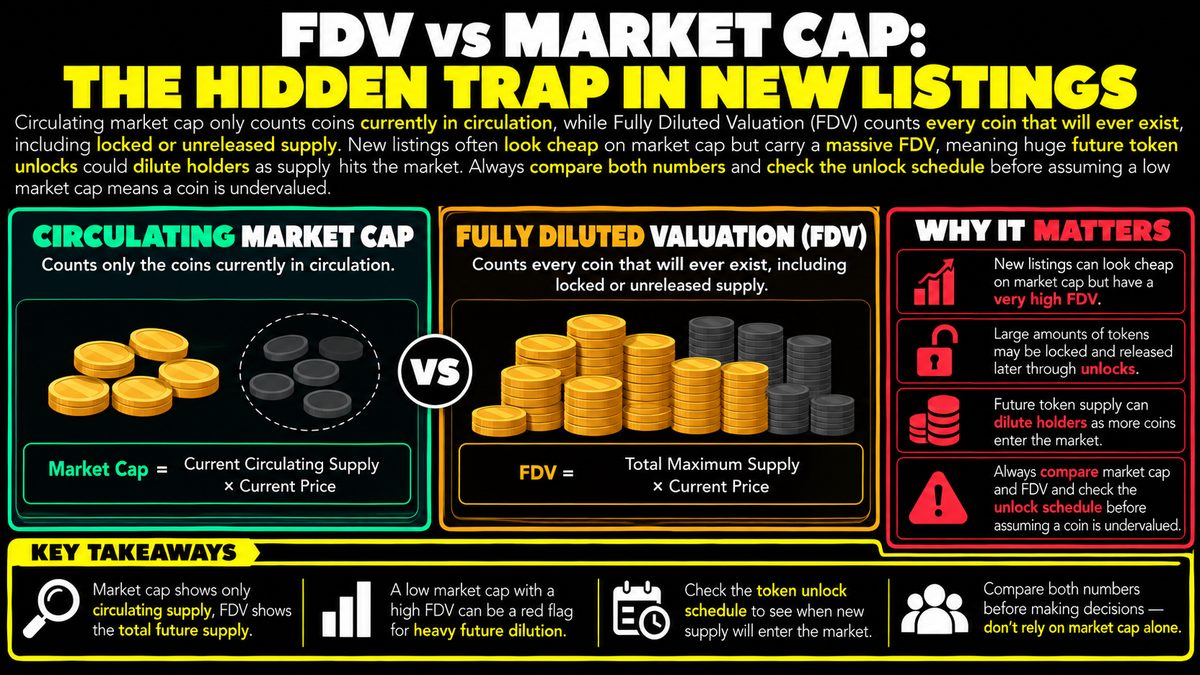
FDV vs Market Cap: Why New Crypto Listings Can Be a Trap
Circulating market cap only counts coins currently in circulation, while Fully Diluted Valuation (FDV) counts every coin that will ever exist, including locked or unreleased…
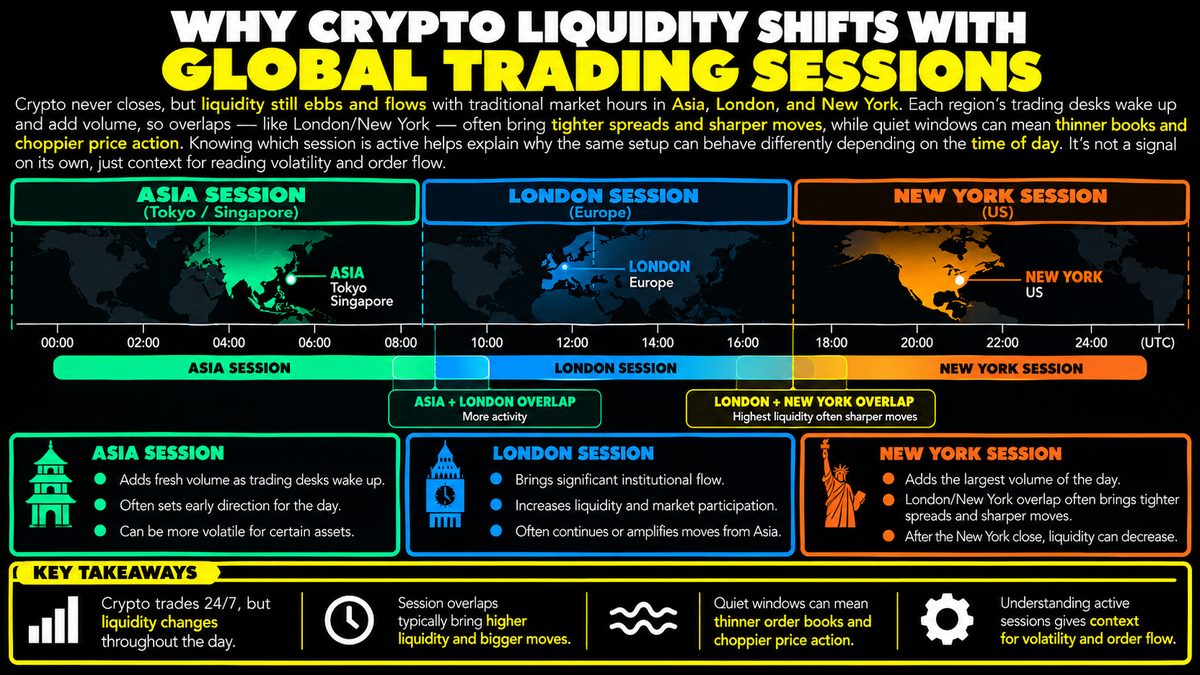
How Crypto Liquidity Shifts Across Global Trading Sessions
Crypto never closes, but liquidity still ebbs and flows with traditional market hours in Asia, London, and New York. Each region's trading desks wake up and add volume, so…
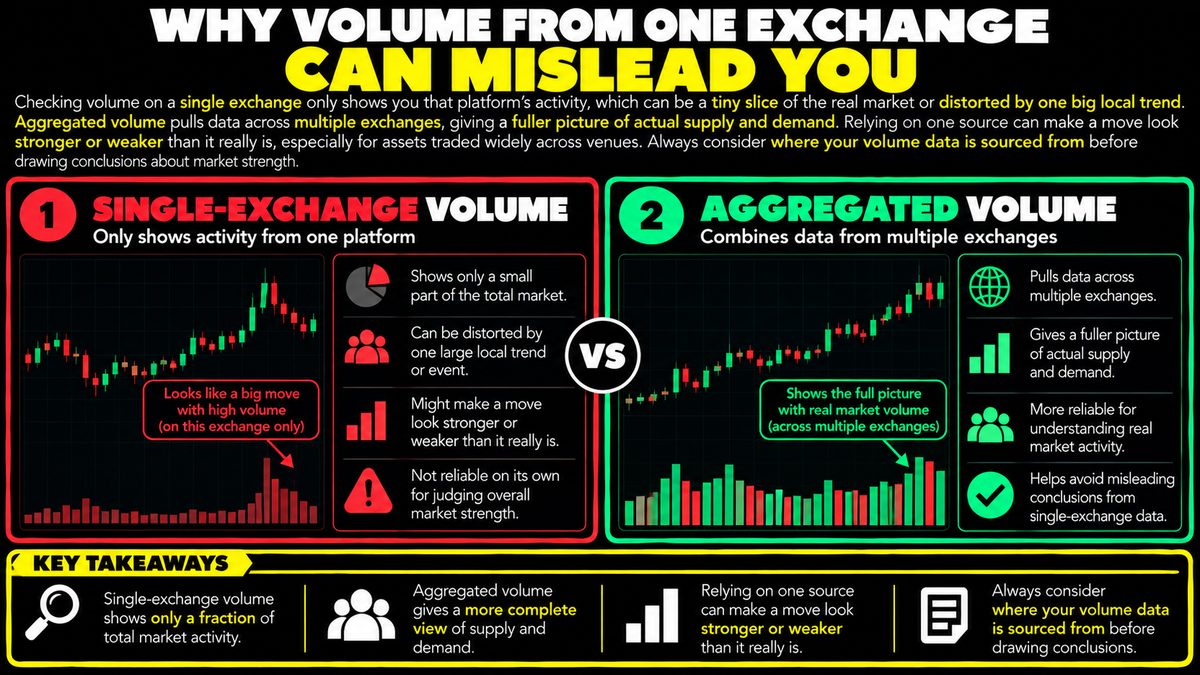
Single Exchange Volume: Why It Can Mislead Traders
Checking volume on a single exchange only shows you that platform's activity, which can be a tiny slice of the real market or distorted by one big local trend. Aggregated volume…
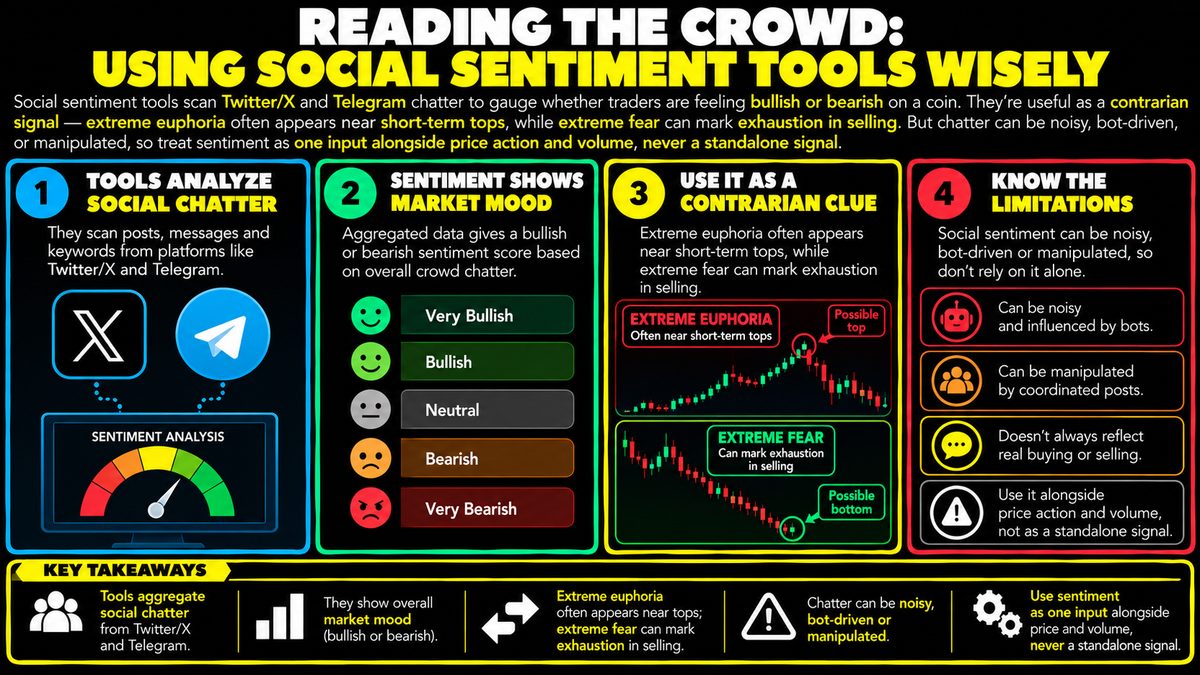
Crypto Social Sentiment Tools: What They Measure and Their Limits
Social sentiment tools scan Twitter/X and Telegram chatter to gauge whether traders are feeling bullish or bearish on a coin. They're useful as a contrarian signal — extreme…
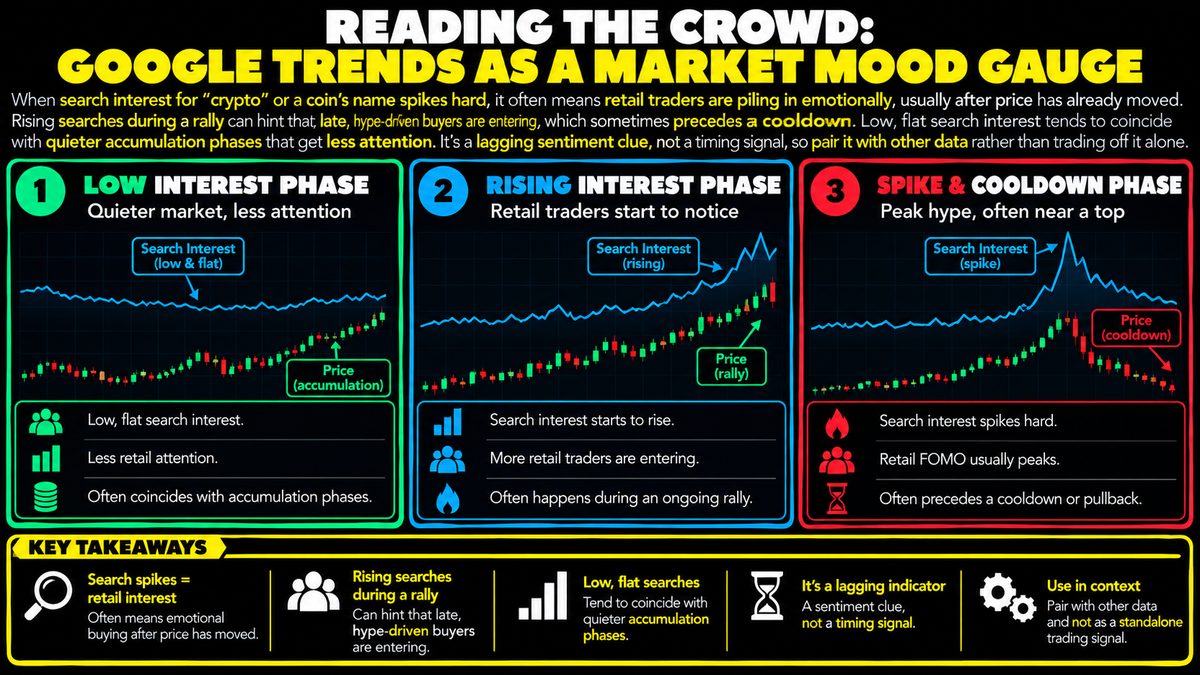
Google Trends and Crypto: What Search Spikes Really Show
When search interest for "crypto" or a coin's name spikes hard, it often means retail traders are piling in emotionally, usually after price has already moved. Rising searches…
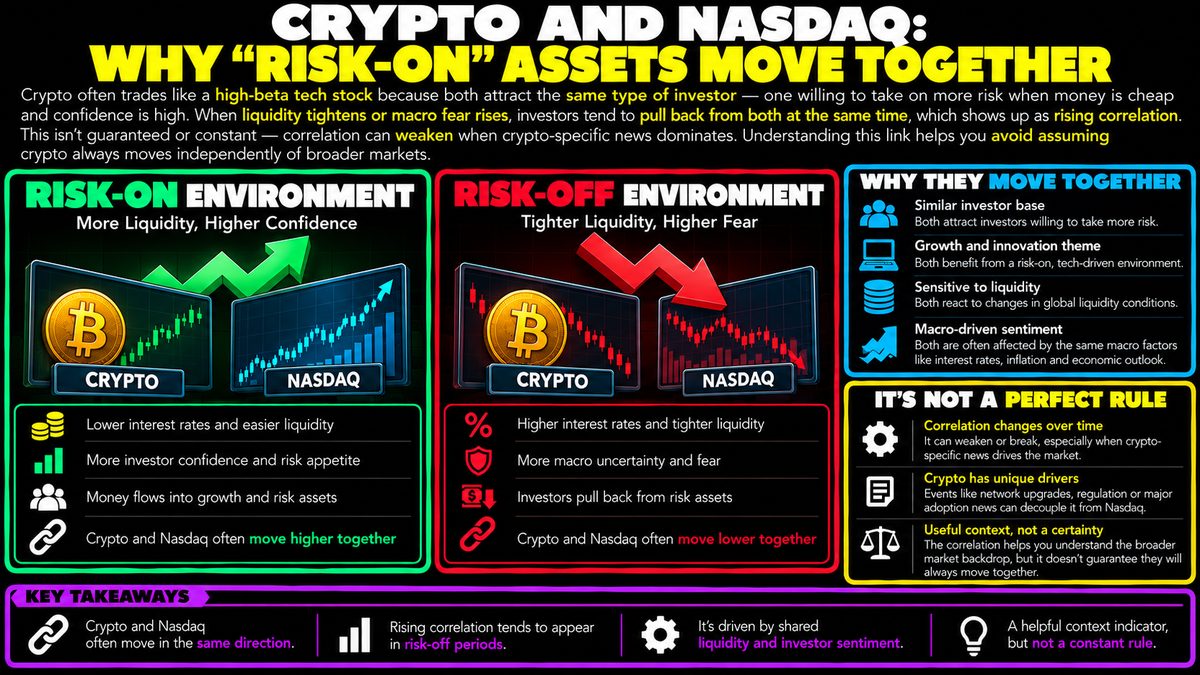
Why Crypto and Nasdaq Move Together as Risk-On Assets
Crypto often trades like a high-beta tech stock because both attract the same type of investor — one willing to take on more risk when money is cheap and confidence is high. When…
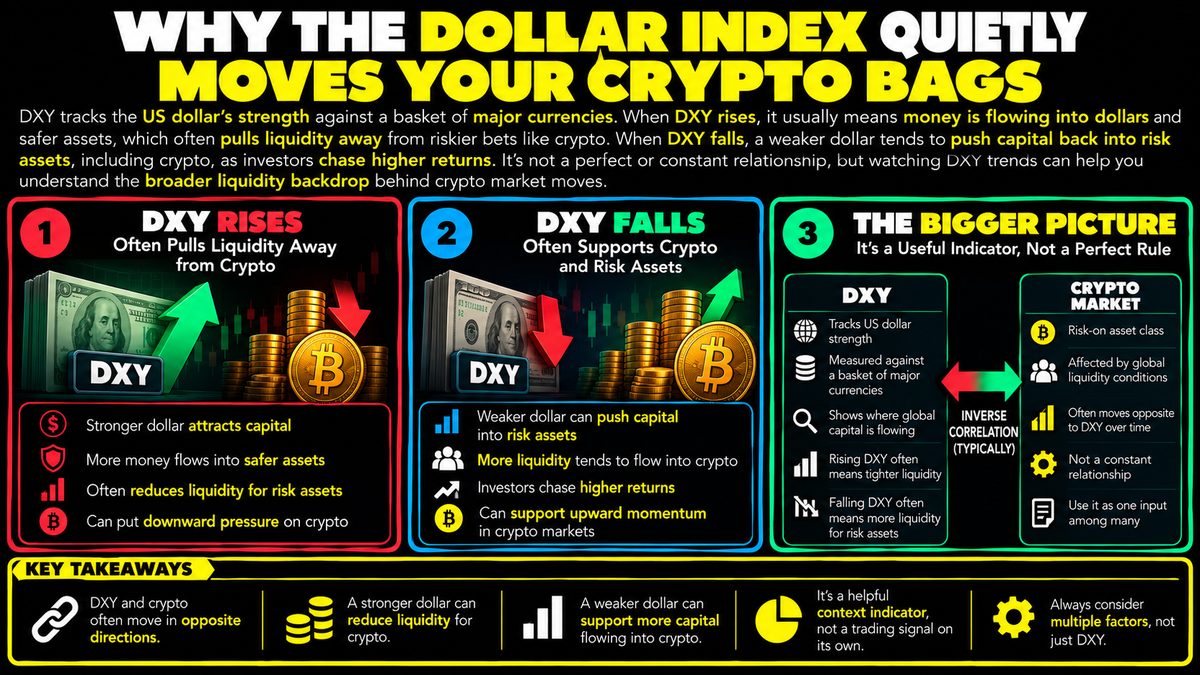
Dollar Index and Crypto Prices: How DXY Affects Bitcoin
DXY tracks the US dollar's strength against a basket of major currencies. When DXY rises, it usually means money is flowing into dollars and safer assets, which often pulls…
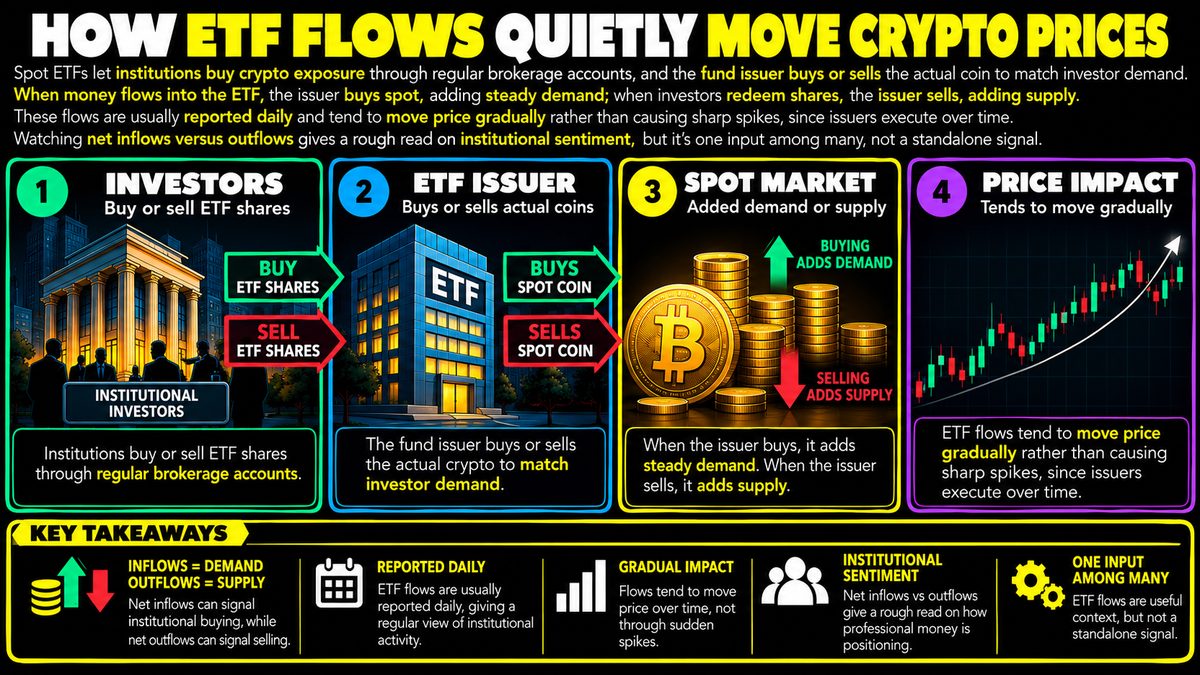
How Spot ETF Inflows and Outflows Affect Crypto Prices
Spot ETFs let institutions buy crypto exposure through regular brokerage accounts, and the fund issuer buys or sells the actual coin to match investor demand. When money flows…
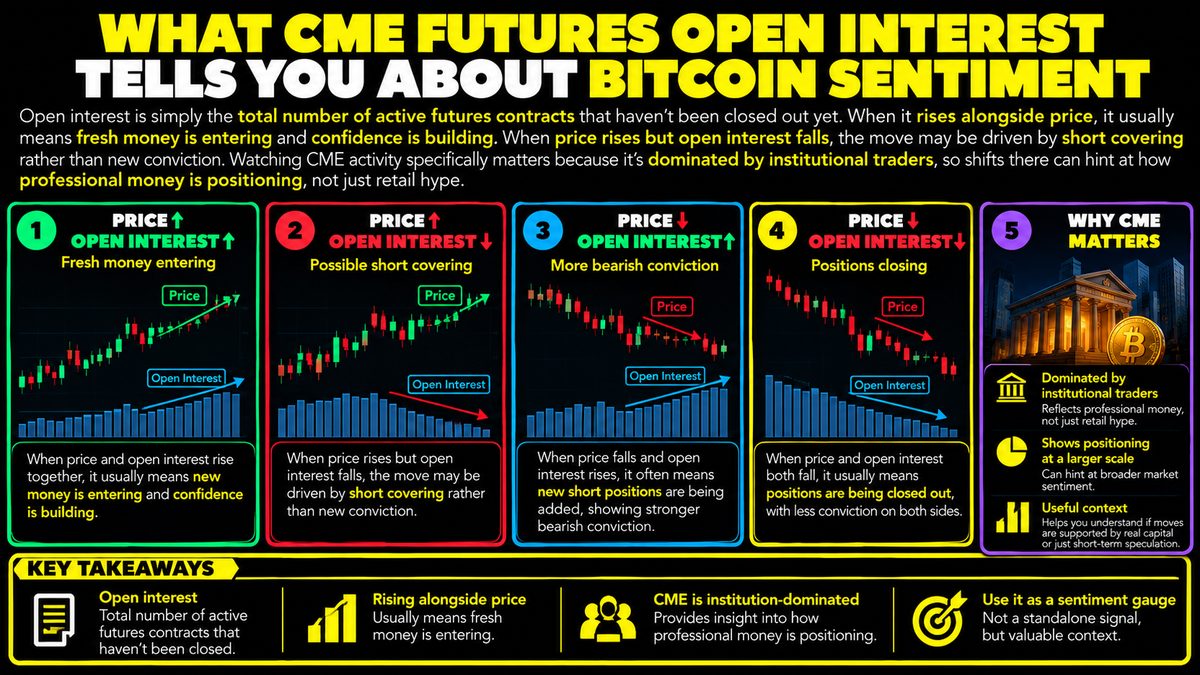
CME Bitcoin Futures Open Interest: What It Tells You
Open interest is simply the total number of active futures contracts that haven't been closed out yet. When it rises alongside price, it usually means fresh money is entering and…
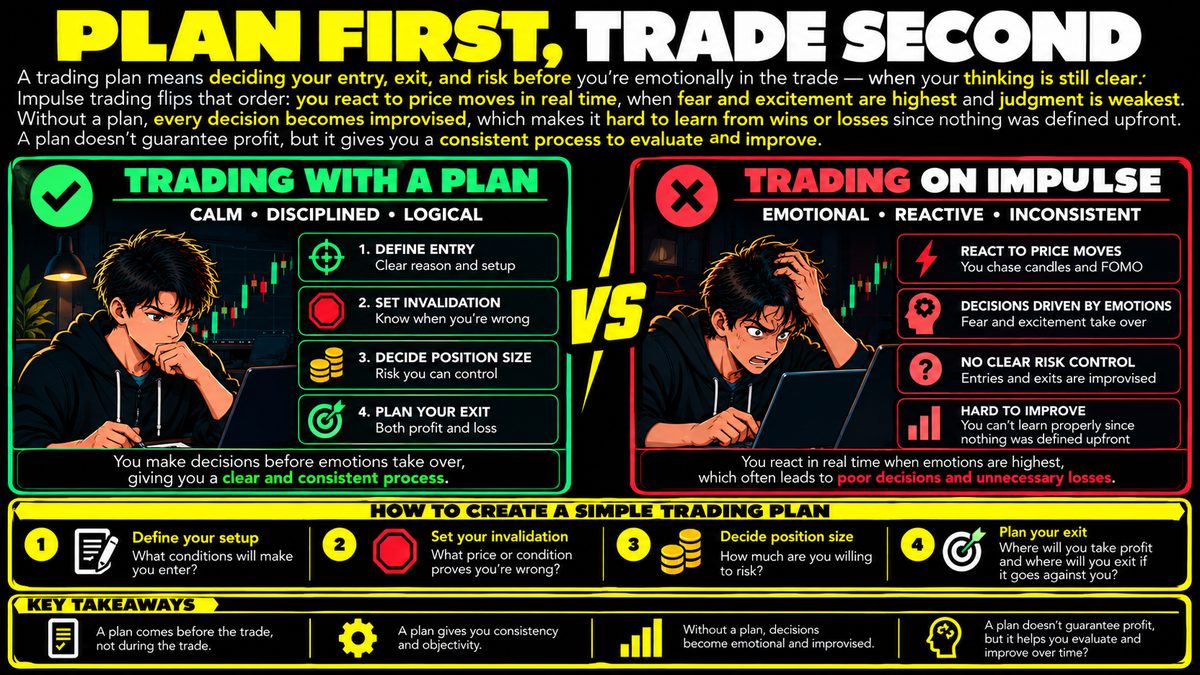
Trading Plan Basics: Why You Should Plan Before You Trade
A trading plan means deciding your entry, exit, and risk before you're emotionally in the trade — when your thinking is still clear. Impulse trading flips that order: you react to…
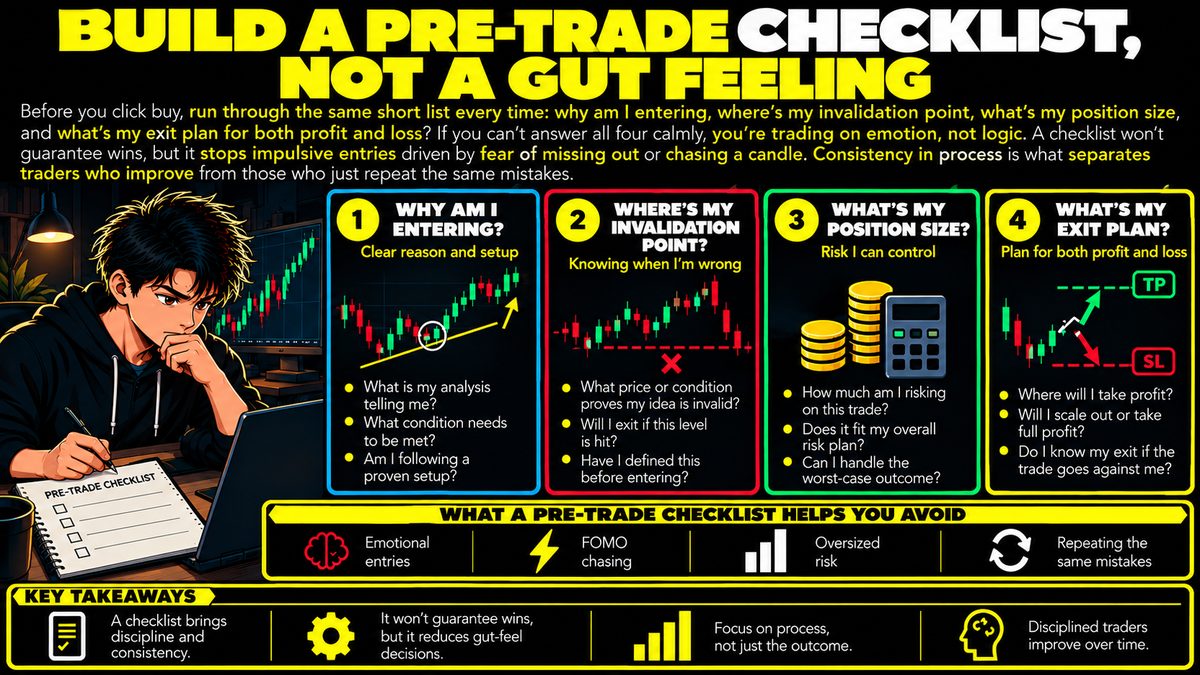
Pre-Trade Checklist: Four Questions to Ask Before Every Trade
Before you click buy, run through the same short list every time: why am I entering, where's my invalidation point, what's my position size, and what's my exit plan for both…
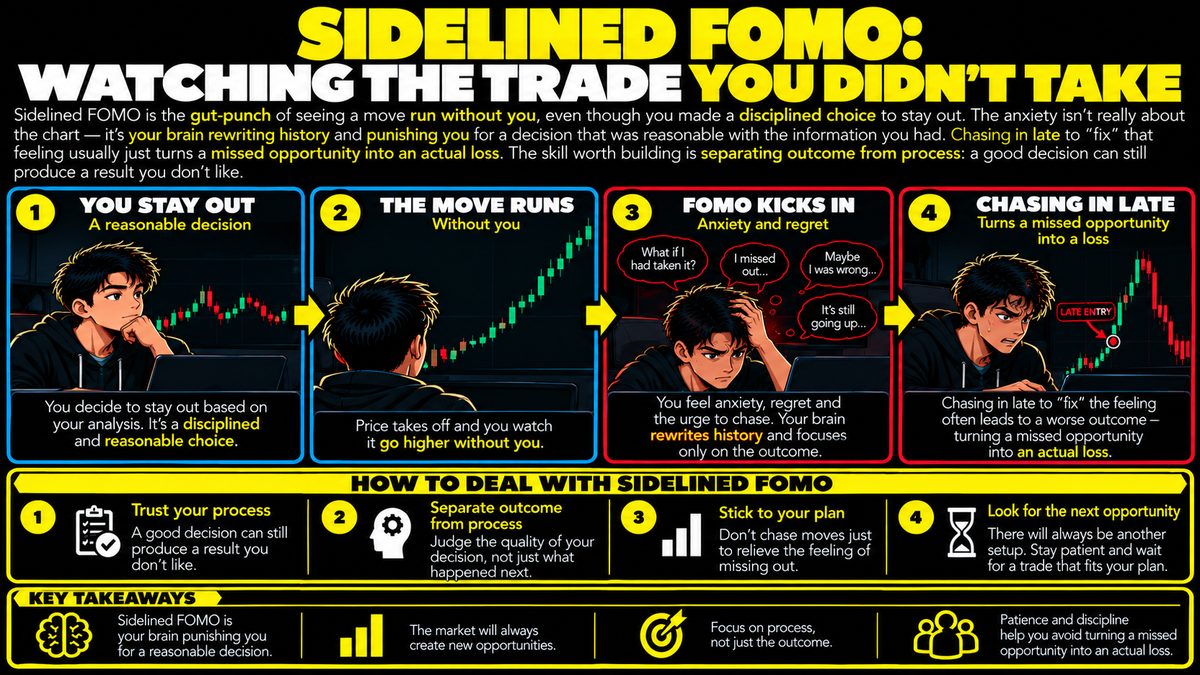
Sidelined FOMO: Why Missing a Trade Still Stings
Sidelined FOMO is the gut-punch of seeing a move run without you, even though you made a disciplined choice to stay out. The anxiety isn't really about the chart — it's your brain…
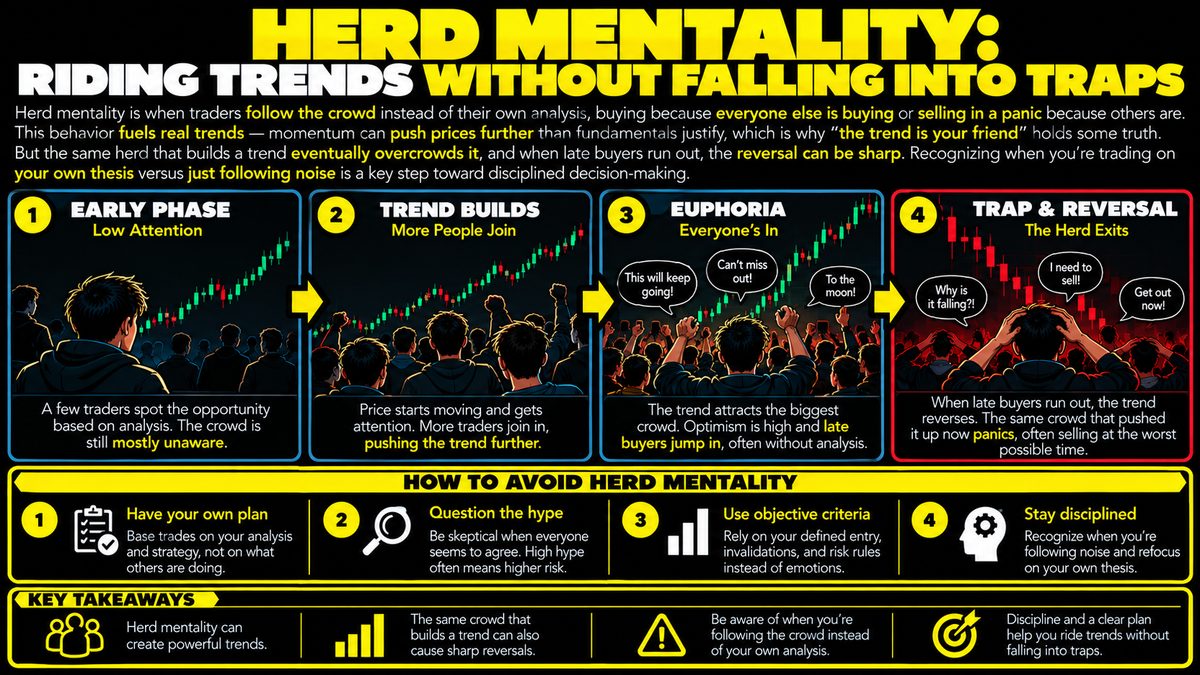
Herd Mentality in Trading: Riding Trends Without Falling Into Traps
Herd mentality is when traders follow the crowd instead of their own analysis, buying because everyone else is buying or selling in a panic because others are. This behavior fuels…
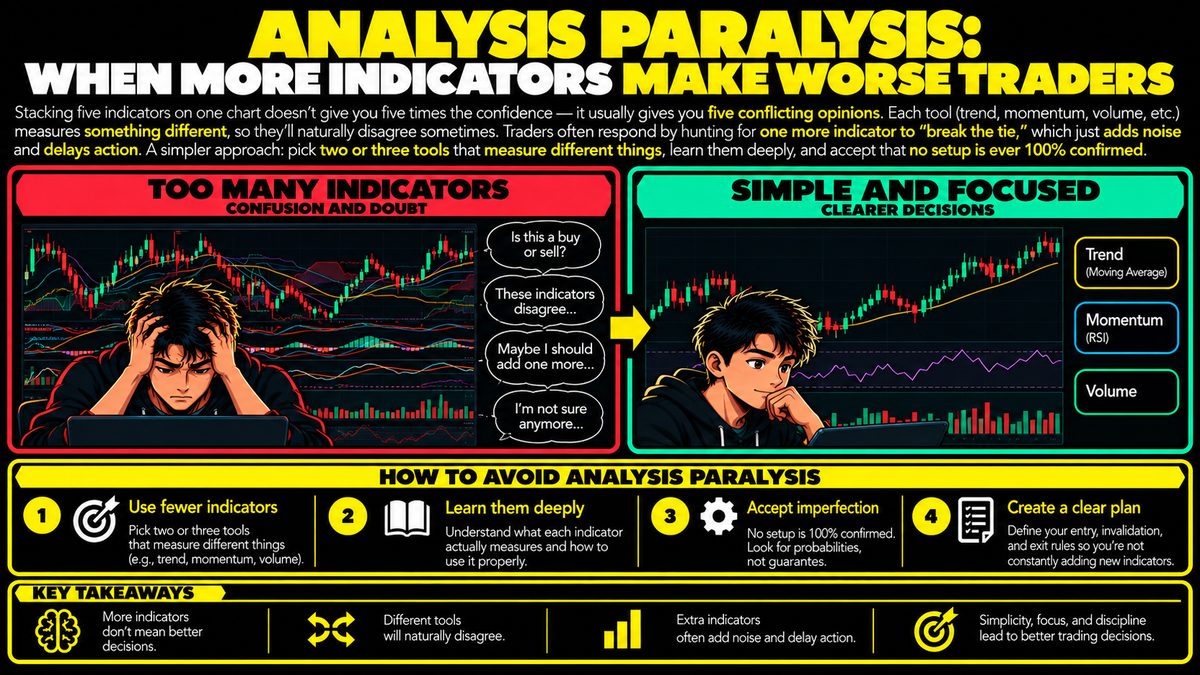
Analysis Paralysis: Why Too Many Indicators Hurt Trading
Stacking five indicators on one chart doesn't give you five times the confidence — it usually gives you five conflicting opinions. Each tool (trend, momentum, volume, etc.)…
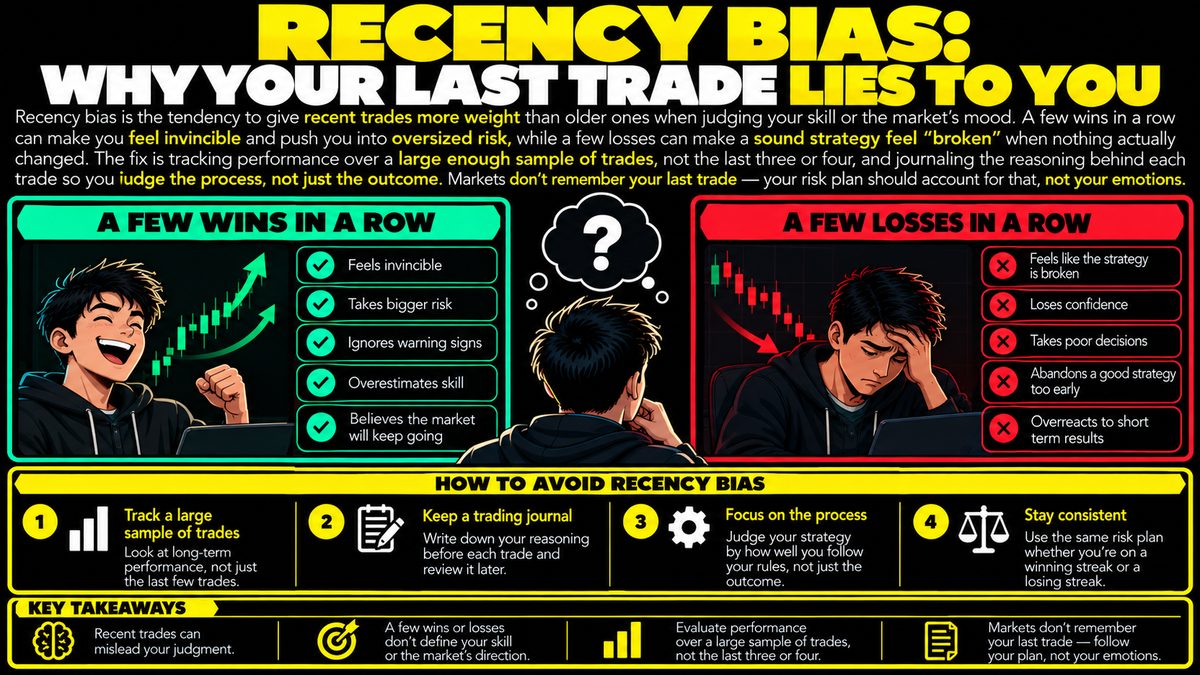
Recency Bias in Trading: Why Your Last Trade Lies to You
Recency bias is the tendency to give recent trades more weight than older ones when judging your skill or the market's mood. A few wins in a row can make you feel invincible and…
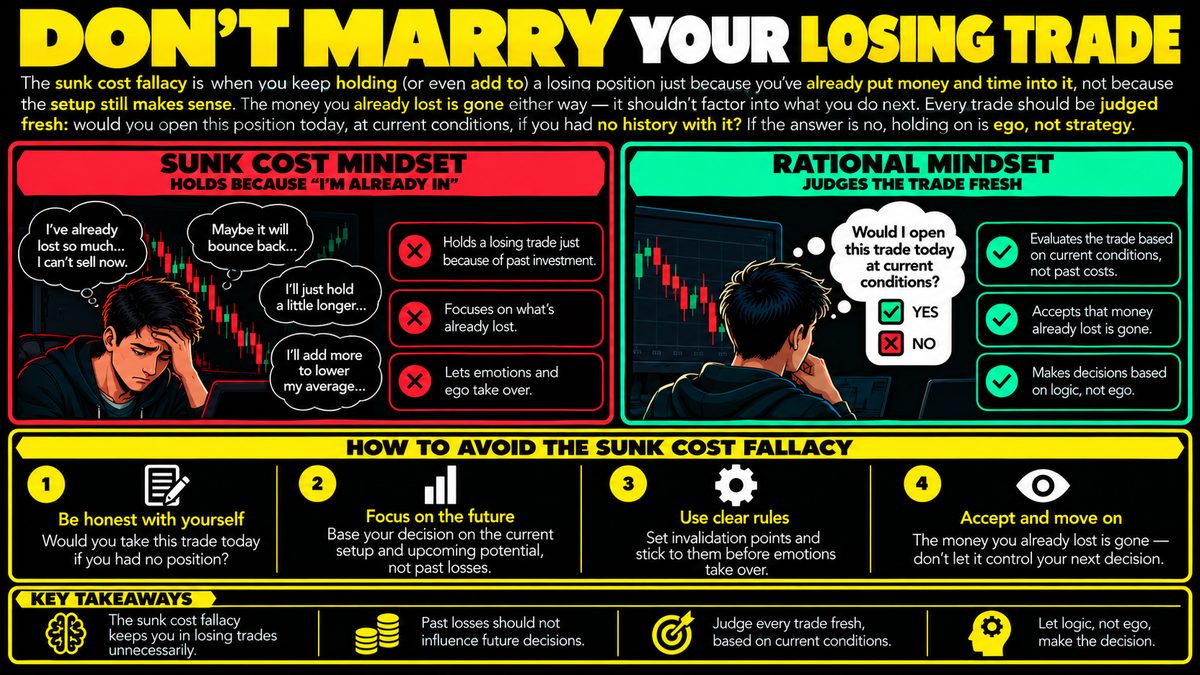
Sunk Cost Fallacy in Trading: Why You Shouldn't Hold Losers
The sunk cost fallacy is when you keep holding (or even add to) a losing position just because you've already put money and time into it, not because the setup still makes sense.…
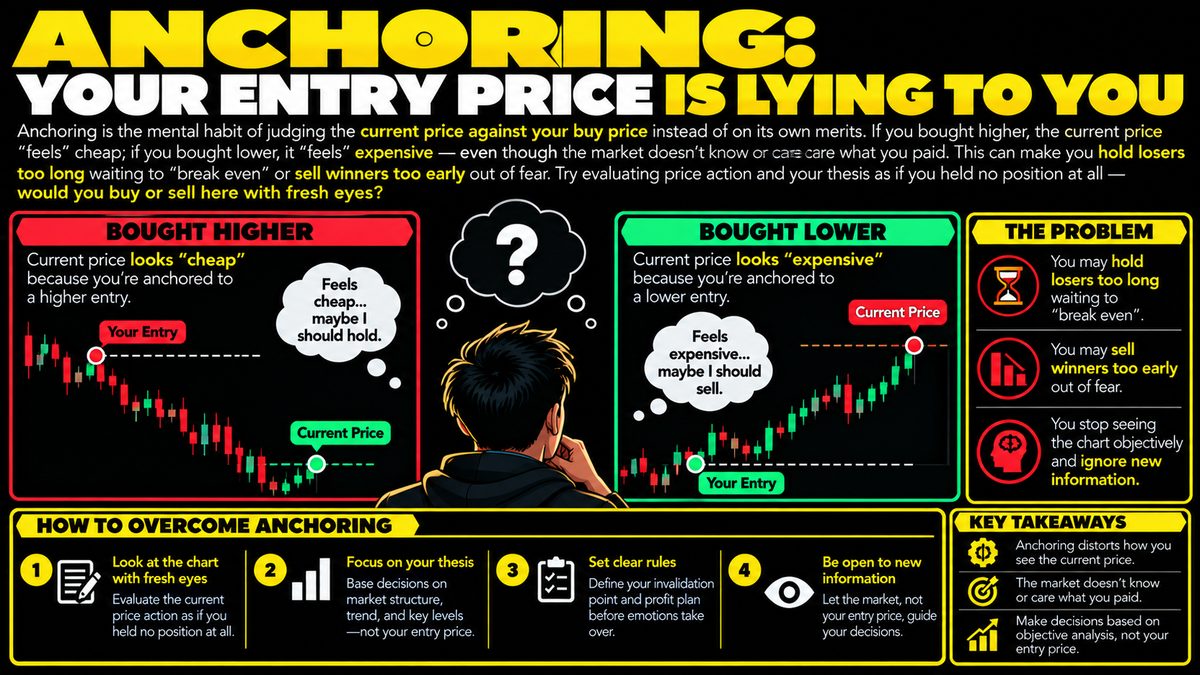
Anchoring Bias in Trading: Why Your Entry Price Is Lying
Anchoring is the mental habit of judging the current price against your buy price instead of on its own merits. If you bought higher, the current price "feels" cheap; if you…
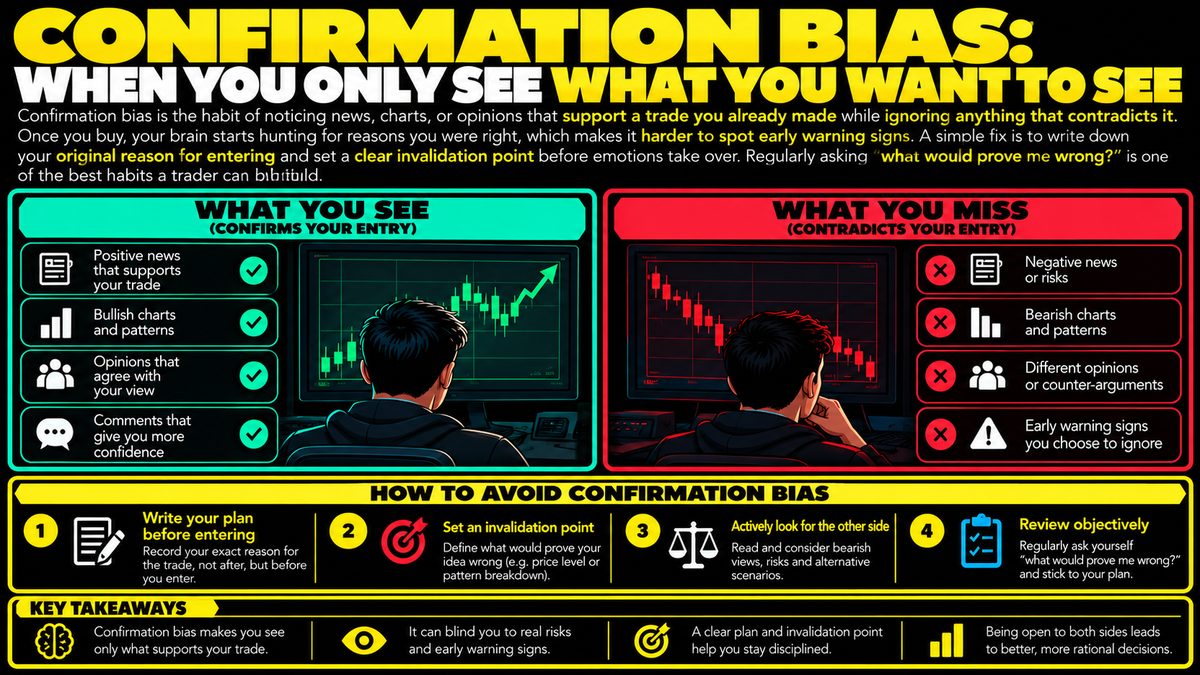
Confirmation Bias in Trading: Why You Only See What You Want
Confirmation bias is the habit of noticing news, charts, or opinions that support a trade you already made while ignoring anything that contradicts it. Once you buy, your brain…
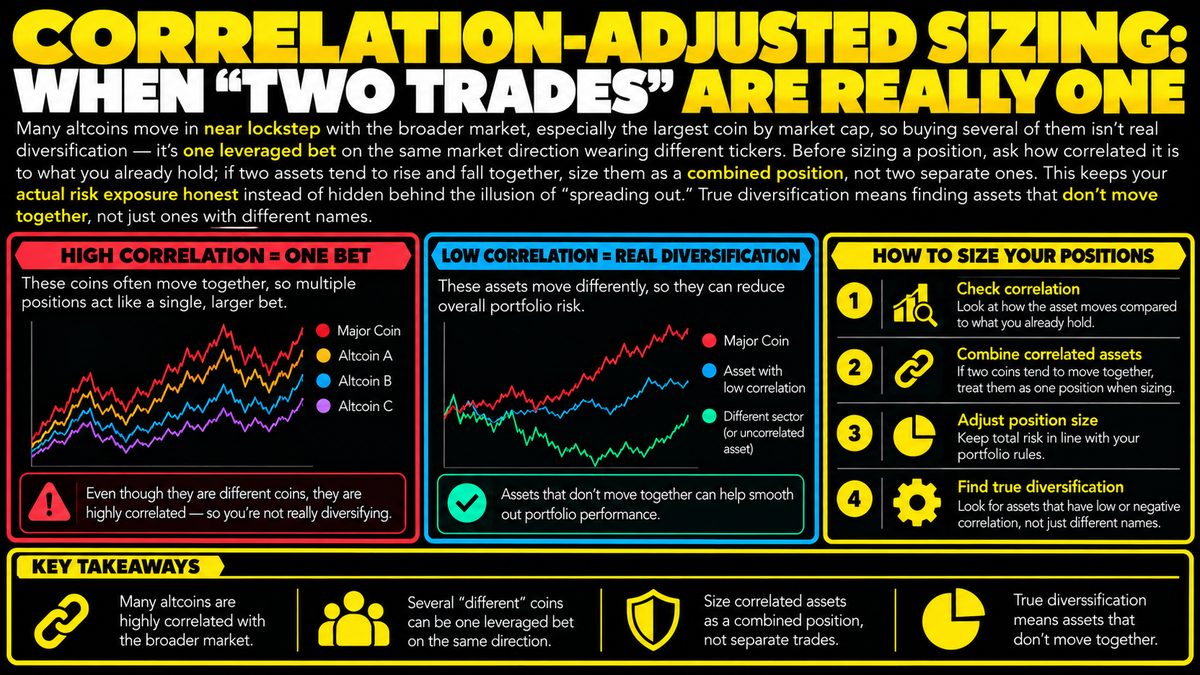
Correlation-Adjusted Position Sizing: Why Many Altcoins Are One Trade
Many altcoins move in near lockstep with the broader market, especially the largest coin by market cap, so buying several of them isn't real diversification — it's one leveraged…
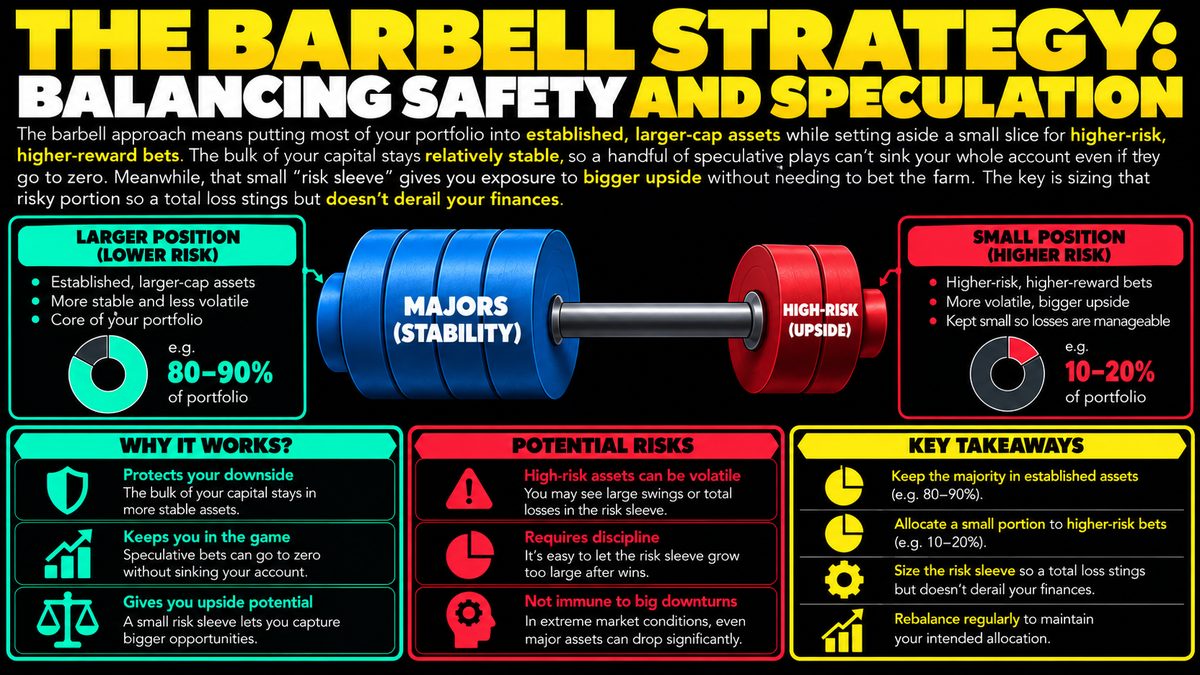
Barbell Strategy in Crypto: Balancing Safety and Speculation
The barbell approach means putting most of your portfolio into established, larger-cap assets while setting aside a small slice for higher-risk, higher-reward bets. The bulk of…
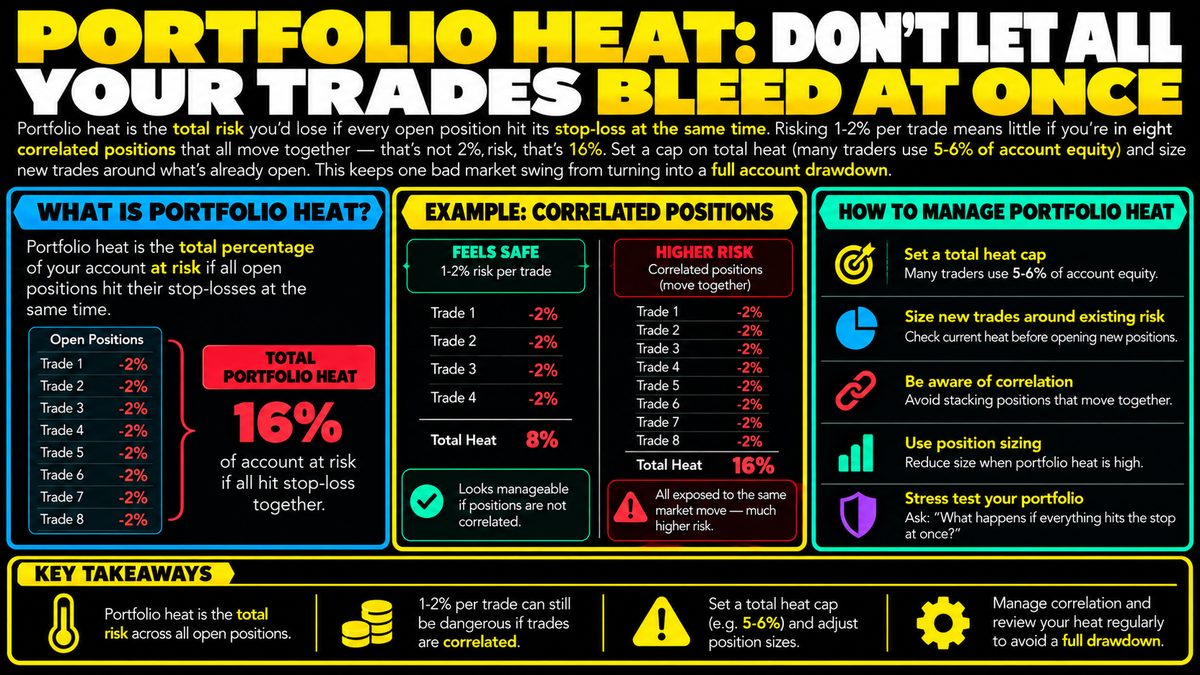
Portfolio Heat: How Much Risk Are Your Open Trades Combined?
Portfolio heat is the total risk you'd lose if every open position hit its stop-loss at the same time. Risking 1-2% per trade means little if you're in eight correlated positions…
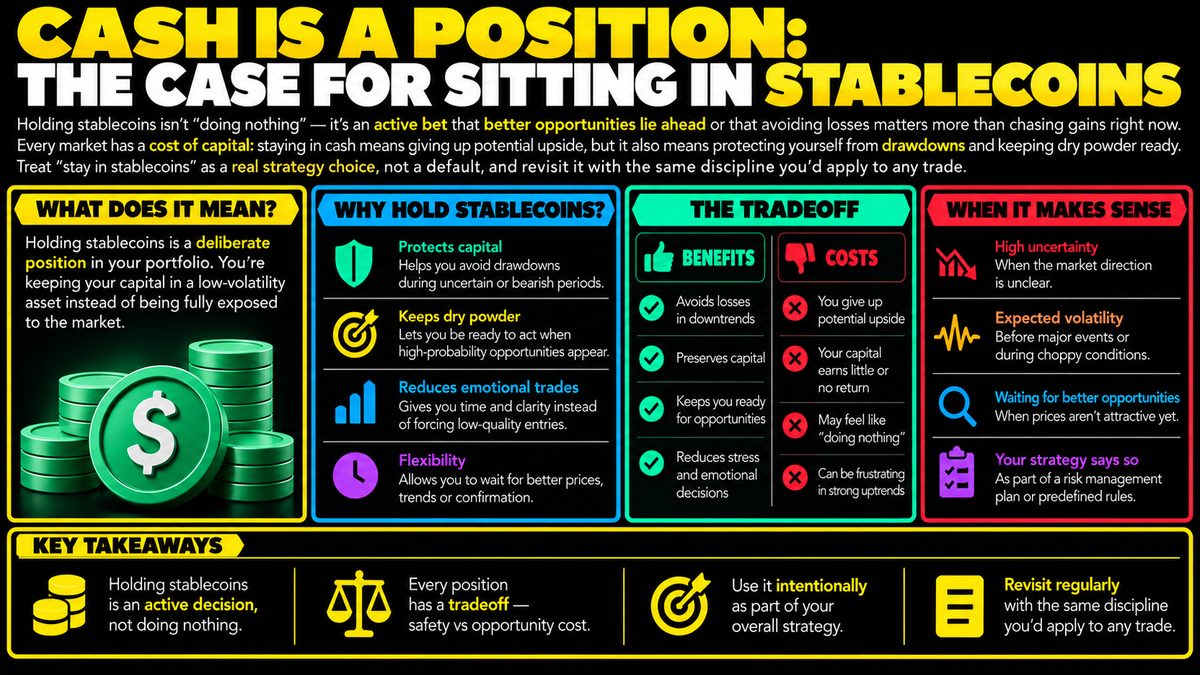
Cash Is a Position: Why Holding Stablecoins Is a Real Strategy
Holding stablecoins isn't "doing nothing" — it's an active bet that better opportunities lie ahead or that avoiding losses matters more than chasing gains right now. Every market…
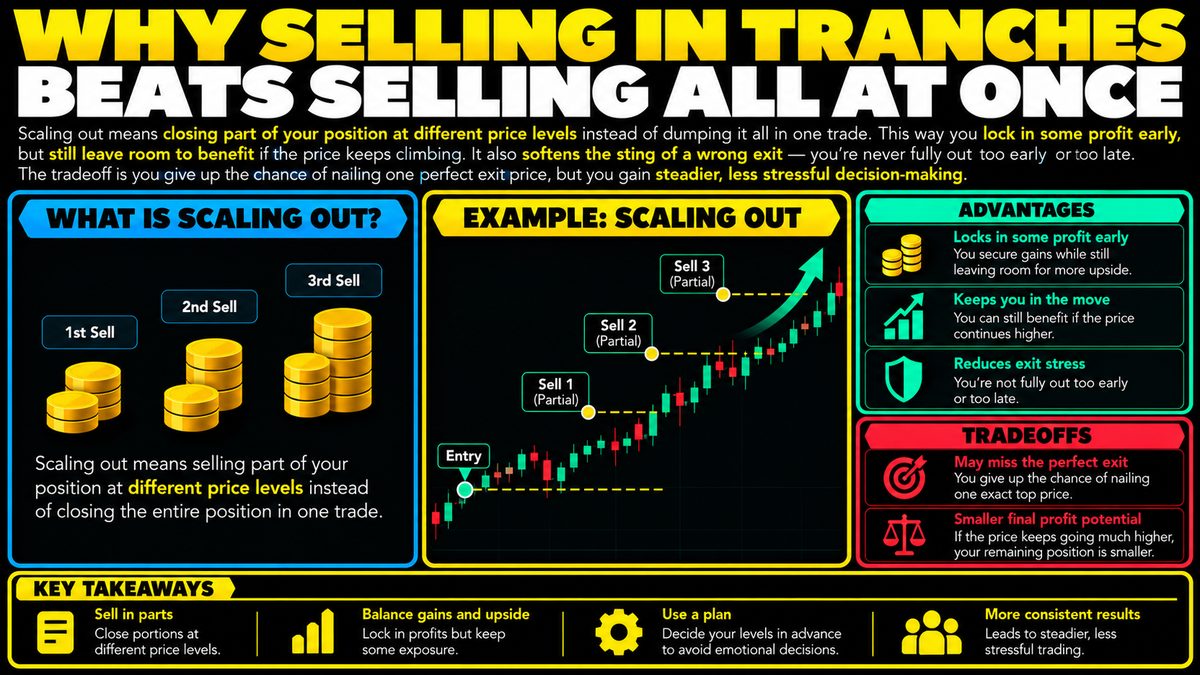
Scaling Out: Why Selling in Tranches Beats Selling All at Once
Scaling out means closing part of your position at different price levels instead of dumping it all in one trade. This way you lock in some profit early, but still leave room to…
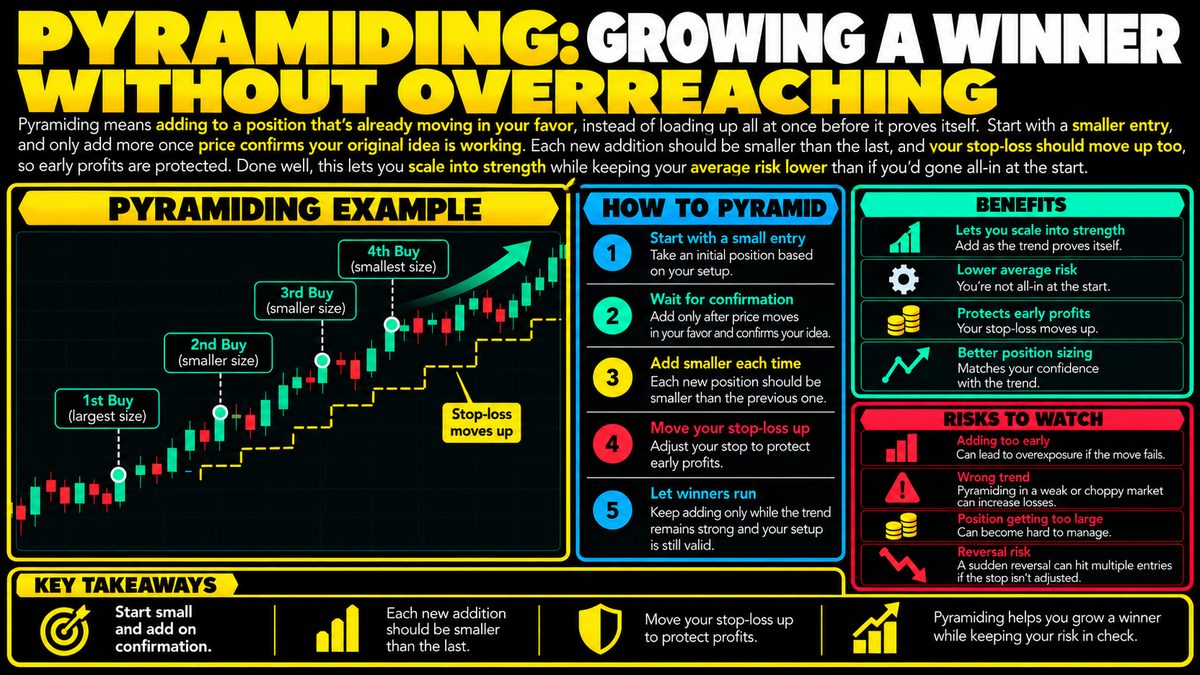
Pyramiding Trading Strategy: How to Scale Into a Winning Position
Pyramiding means adding to a position that's already moving in your favor, instead of loading up all at once before it proves itself. Start with a smaller entry, and only add more…
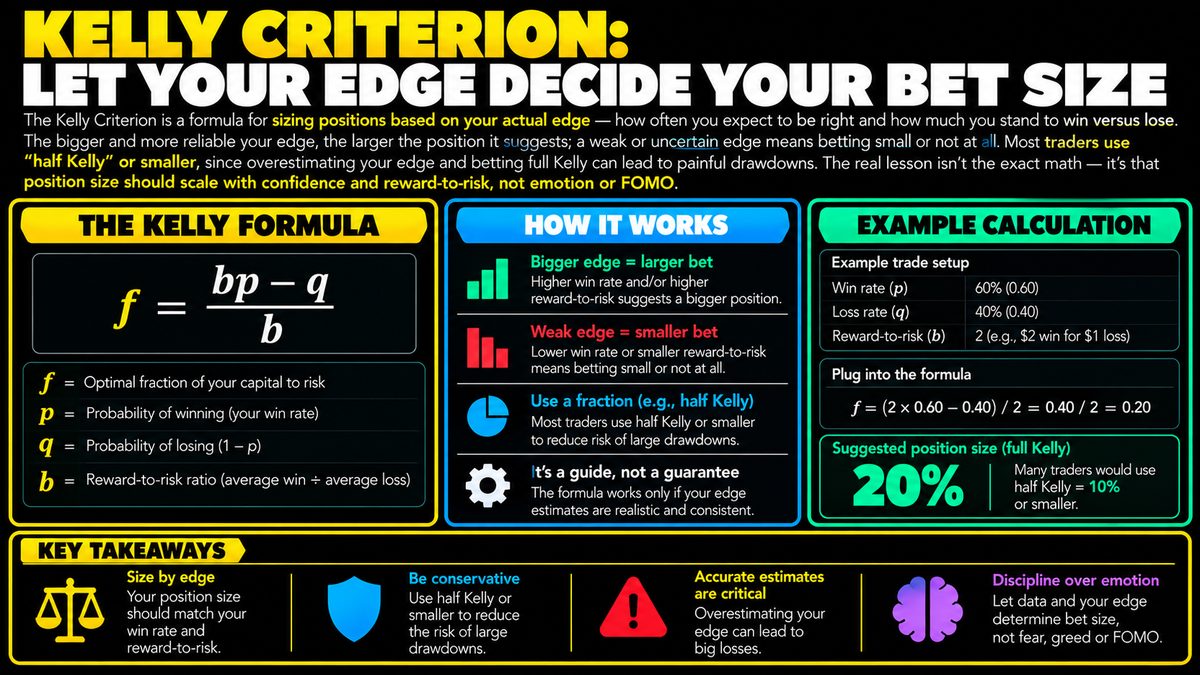
Kelly Criterion: How to Size Crypto Trades Using Your Edge
The Kelly Criterion is a formula for sizing positions based on your actual edge — how often you expect to be right and how much you stand to win versus lose. The bigger and more…
Launchpad vs Launchpool: How New Tokens Reach Traders
A launchpad is where a new project sells or distributes tokens directly to users, often through a sale or subscription, before the token lists on the open market. A launchpool…
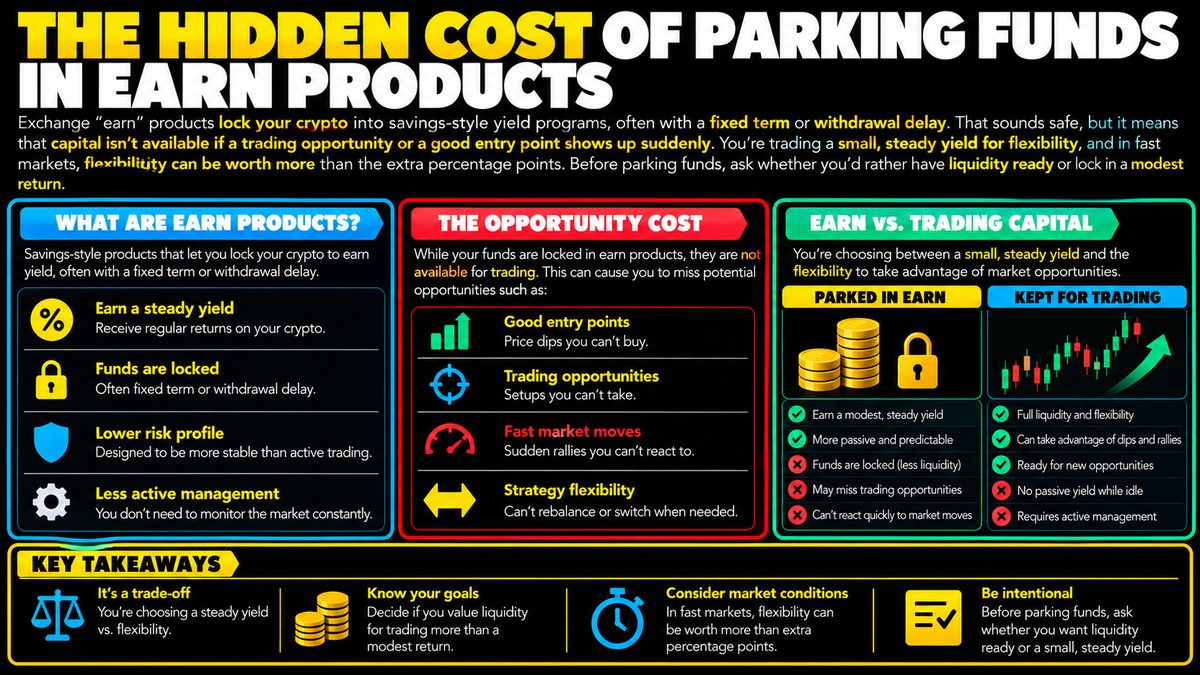
Earn Products: The Hidden Cost of Locking Up Your Crypto
Exchange "earn" products lock your crypto into savings-style yield programs, often with a fixed term or withdrawal delay. That sounds safe, but it means that capital isn't…
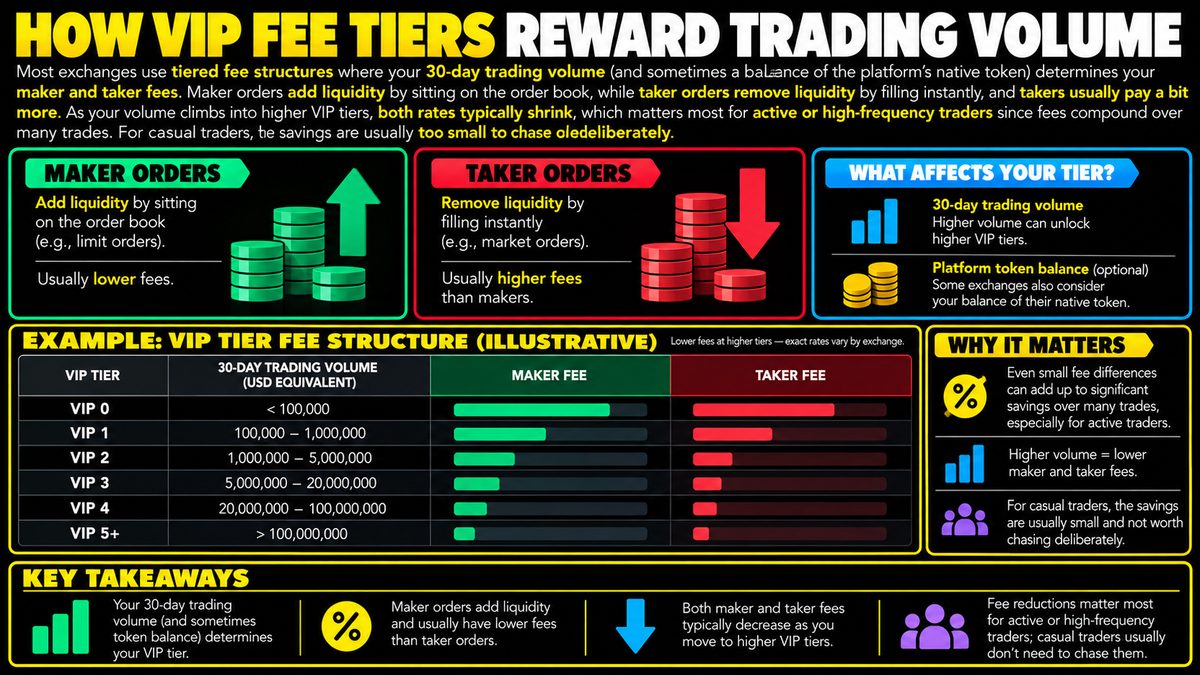
What Are VIP Fee Tiers and How Do They Reduce Trading Costs
Most exchanges use tiered fee structures where your 30-day trading volume (and sometimes a balance of the platform's native token) determines your maker and taker fees. Maker…
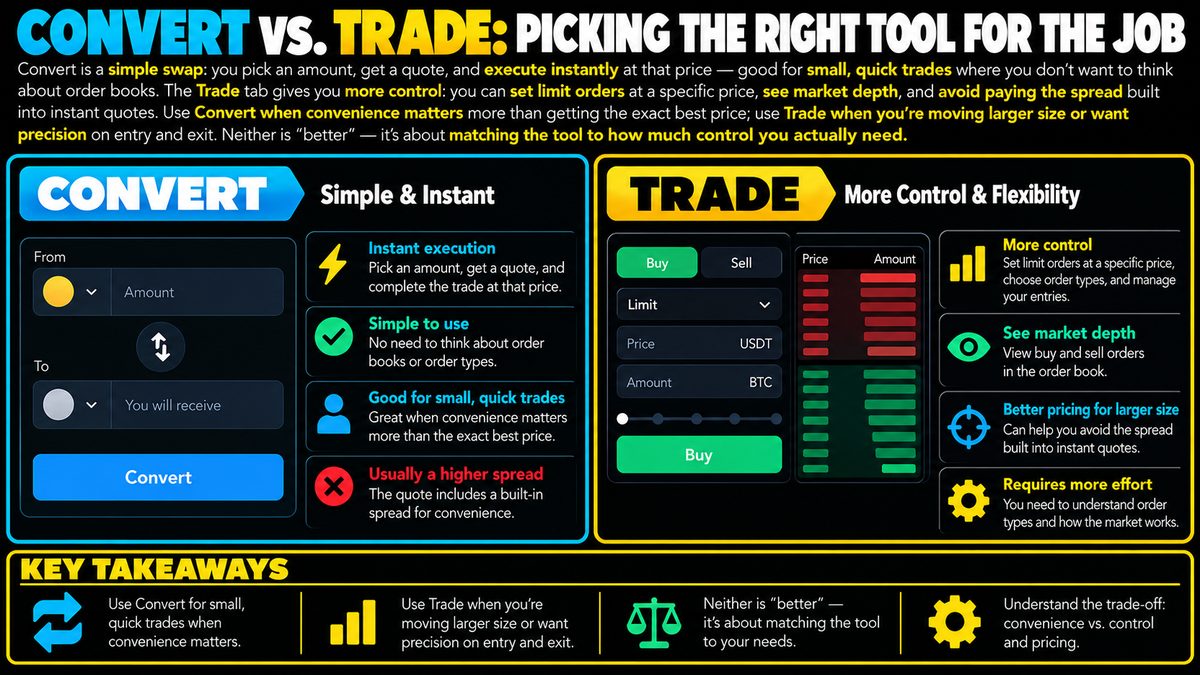
Convert vs Trade: Which Crypto Tool Fits Your Situation
Convert is a simple swap: you pick an amount, get a quote, and execute instantly at that price — good for small, quick trades where you don't want to think about order books. The…
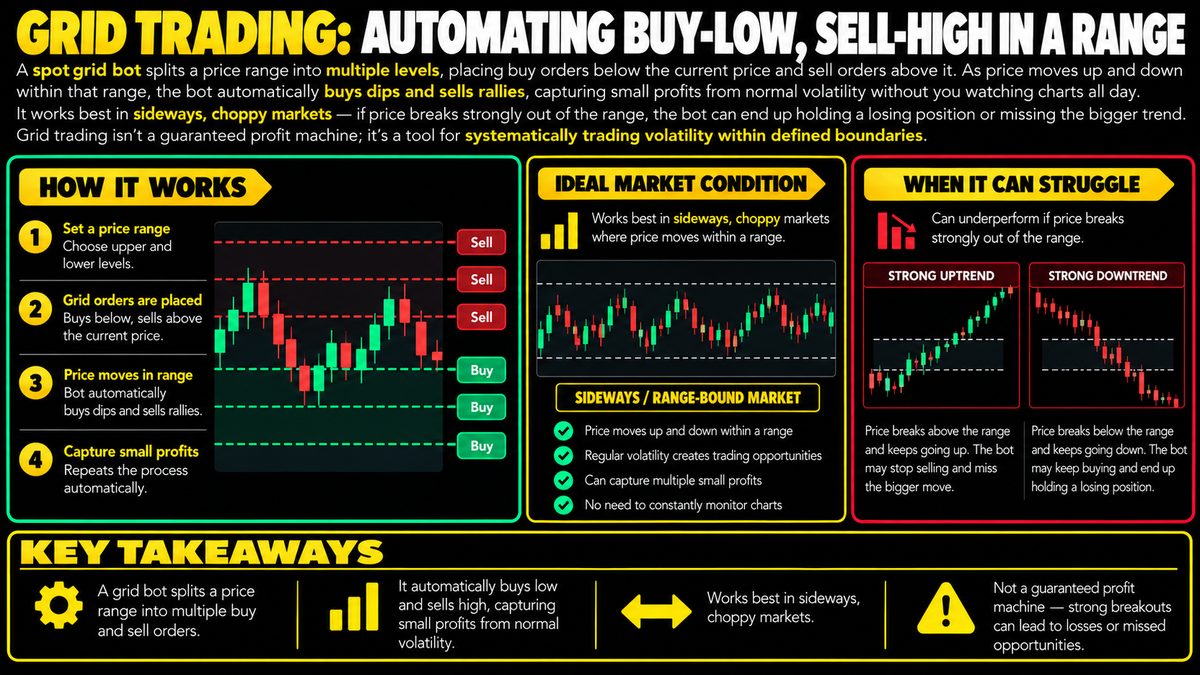
Grid Trading Bots: How They Work and When They Fail
A spot grid bot splits a price range into multiple levels, placing buy orders below the current price and sell orders above it. As price moves up and down within that range, the…
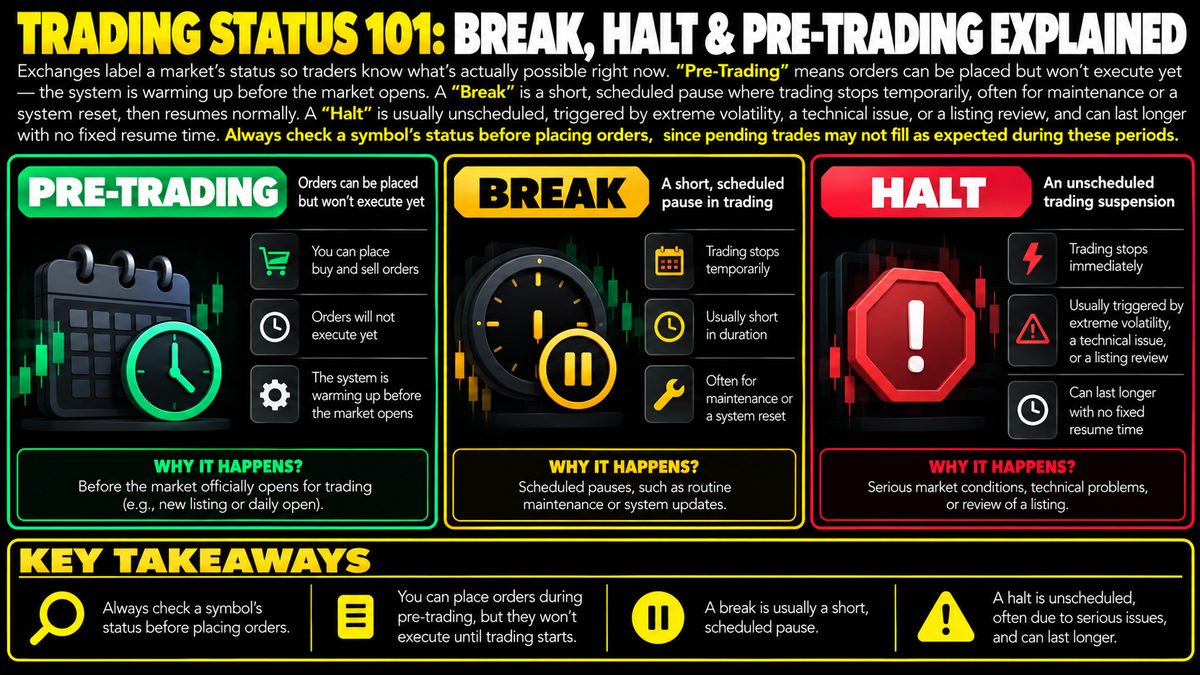
Trading Status Explained: Pre-Trading, Break, and Halt
Exchanges label a market's status so traders know what's actually possible right now. "Pre-Trading" means orders can be placed but won't execute yet — the system is warming up…
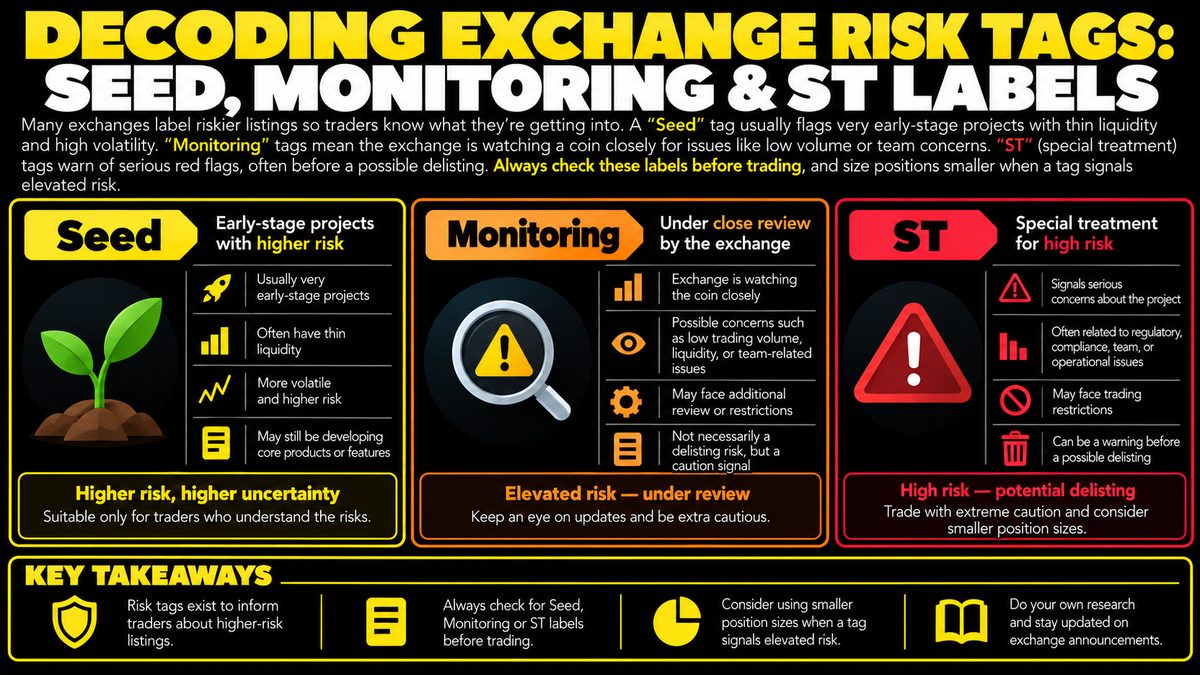
Exchange Risk Tags: What Seed, Monitoring, and ST Labels Mean
Many exchanges label riskier listings so traders know what they're getting into. A "Seed" tag usually flags very early-stage projects with thin liquidity and high volatility.…
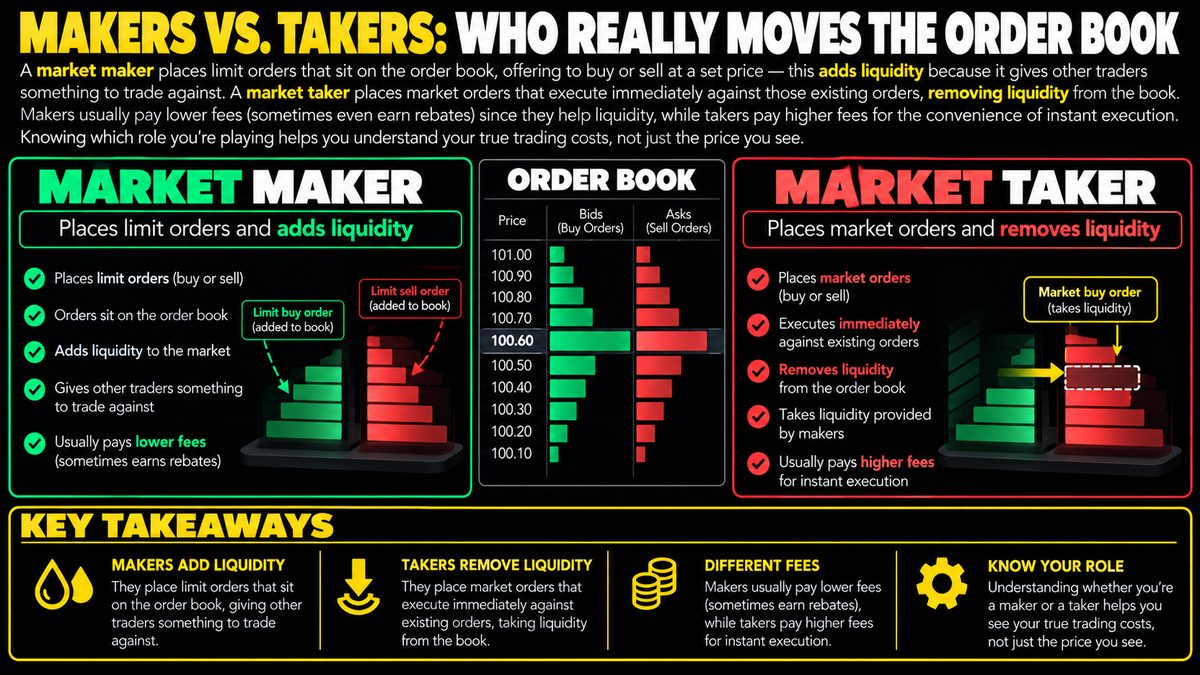
Maker vs Taker Fees: How Order Types Affect Trading Costs
A market maker places limit orders that sit on the order book, offering to buy or sell at a set price — this adds liquidity because it gives other traders something to trade…
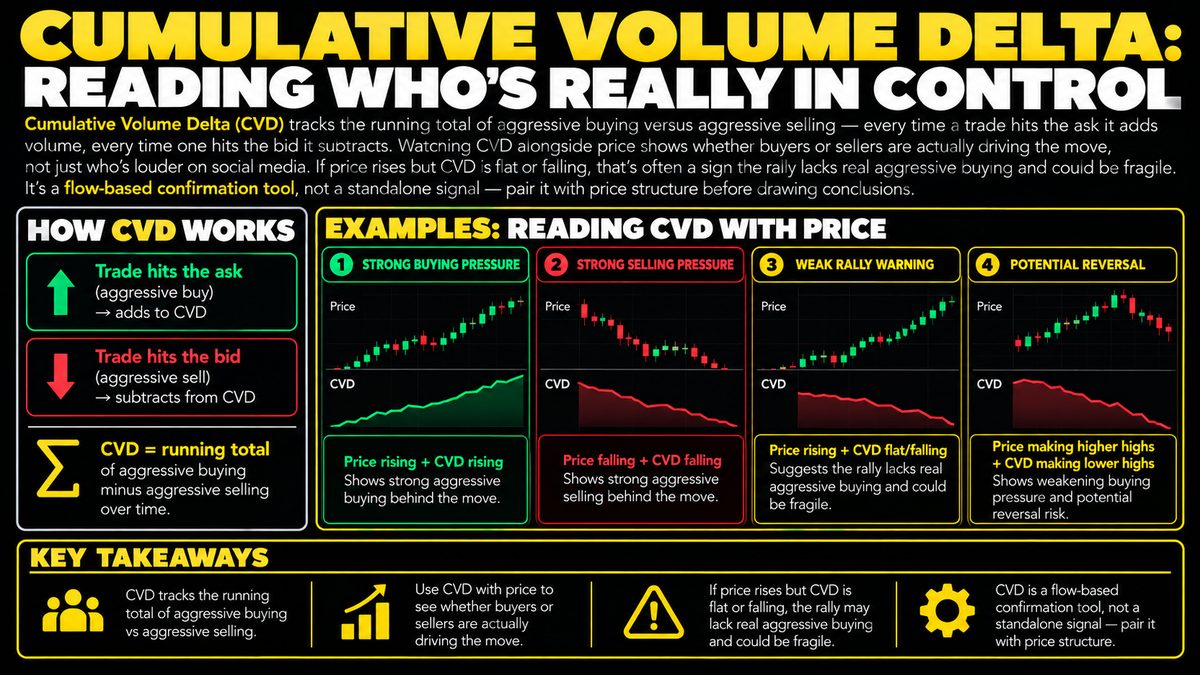
Cumulative Volume Delta: What It Measures and How to Read It
Cumulative Volume Delta (CVD) tracks the running total of aggressive buying versus aggressive selling — every time a trade hits the ask it adds volume, every time one hits the bid…
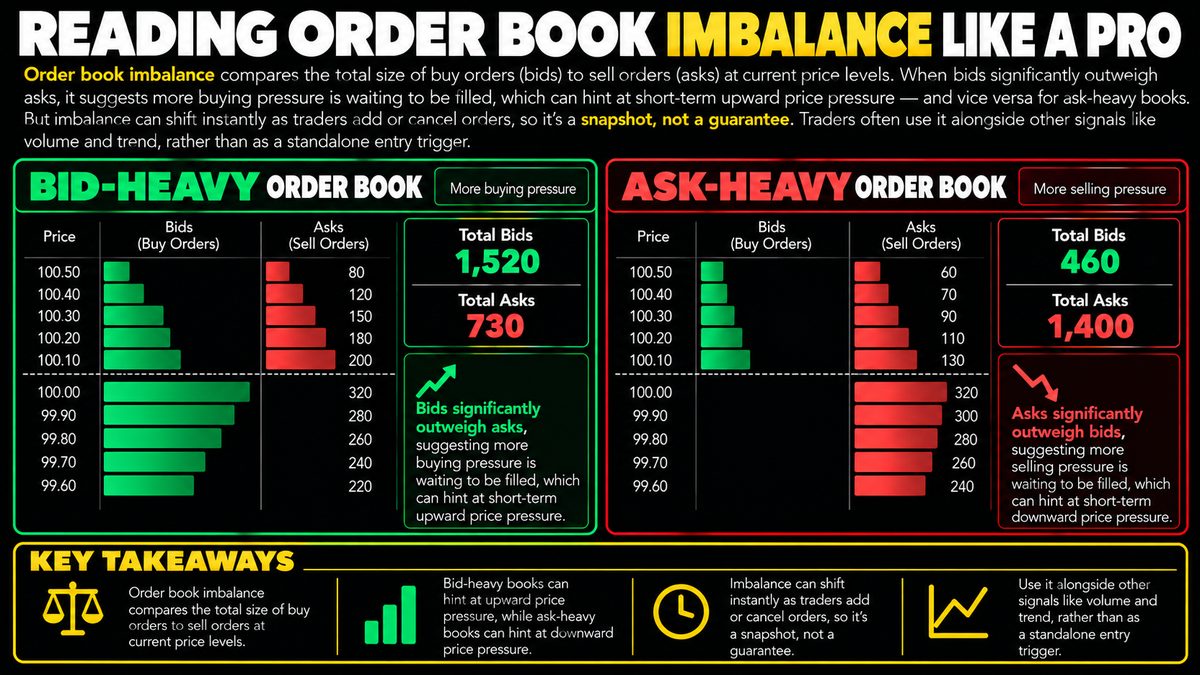
Order Book Imbalance: How to Read It and Its Limits
Order book imbalance compares the total size of buy orders (bids) to sell orders (asks) at current price levels. When bids significantly outweigh asks, it suggests more buying…
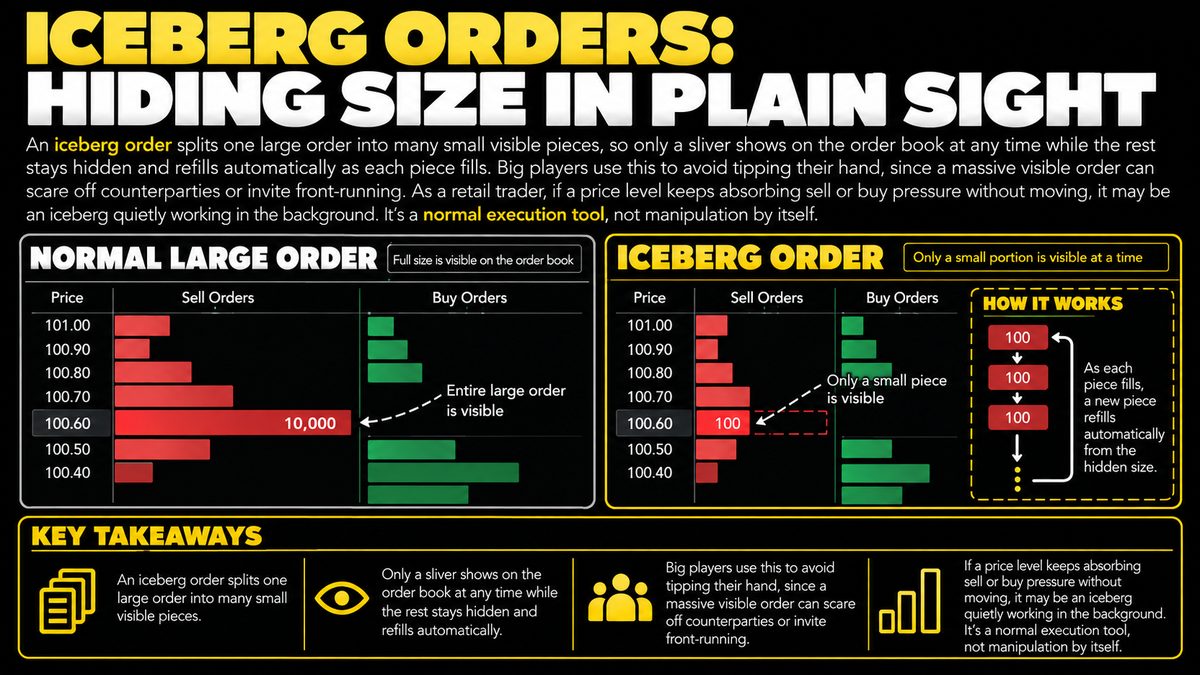
Iceberg Orders: How Traders Hide Large Trade Sizes
An iceberg order splits one large order into many small visible pieces, so only a sliver shows on the order book at any time while the rest stays hidden and refills automatically…
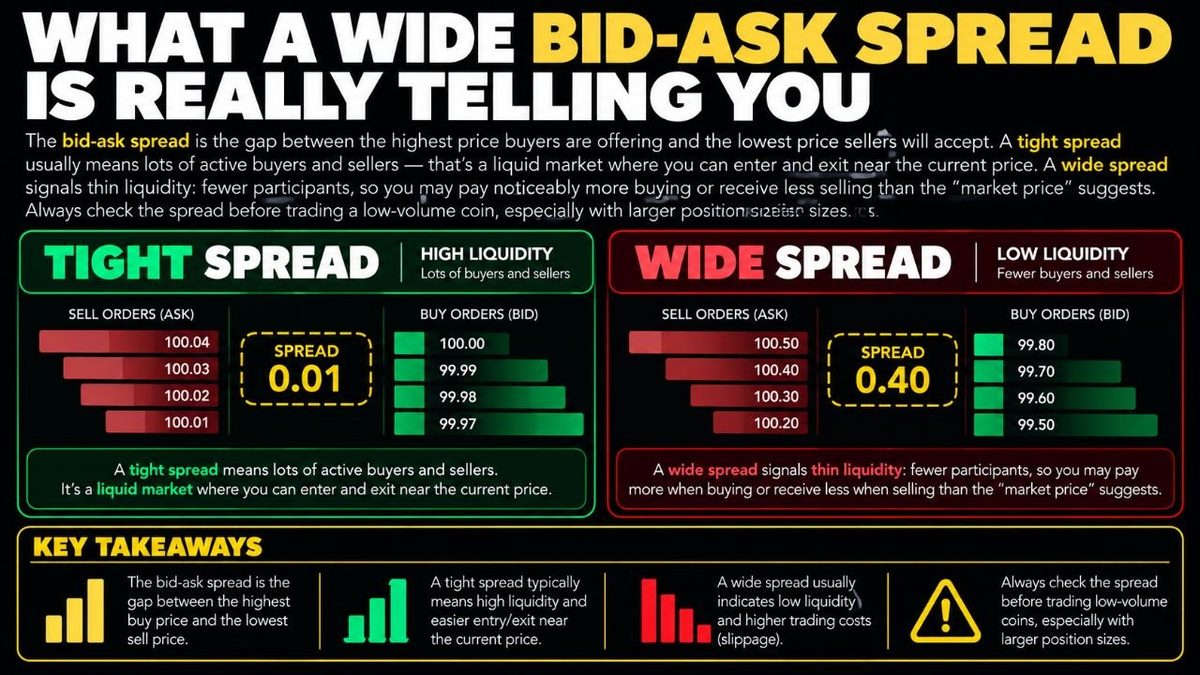
What a Wide Bid-Ask Spread Tells You About a Crypto Market
The bid-ask spread is the gap between the highest price buyers are offering and the lowest price sellers will accept. A tight spread usually means lots of active buyers and…
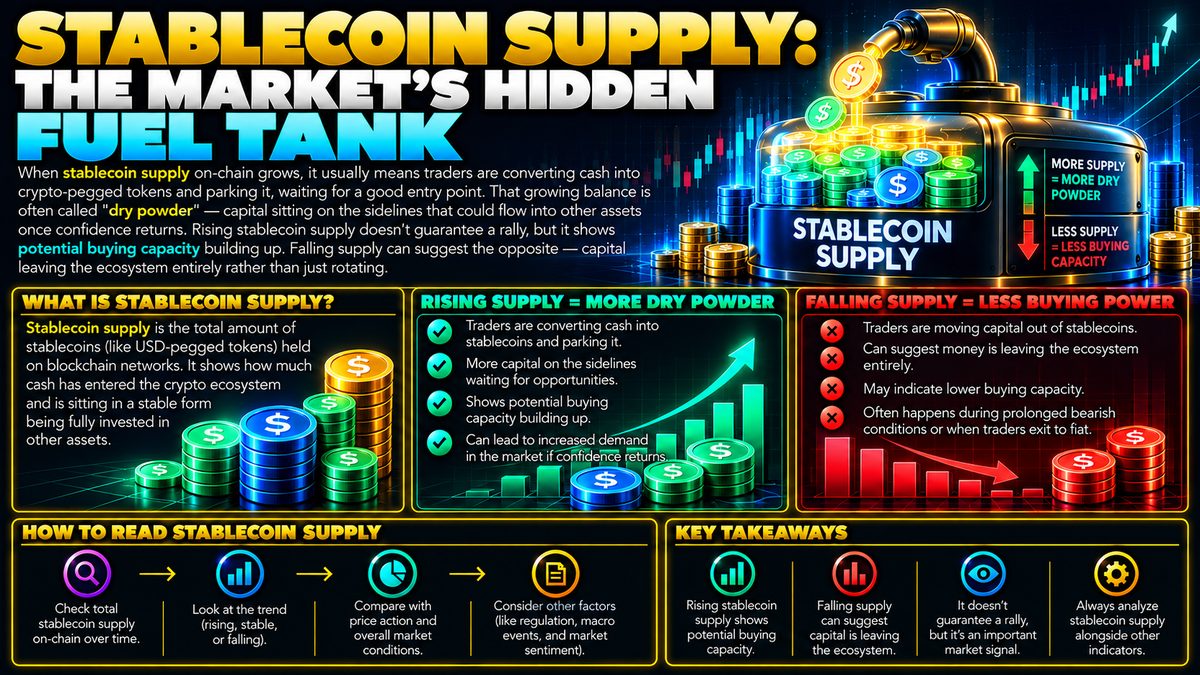
Stablecoin Supply: What Rising or Falling Levels Signal
When stablecoin supply on-chain grows, it usually means traders are converting cash into crypto-pegged tokens and parking it, waiting for a good entry point. That growing balance…
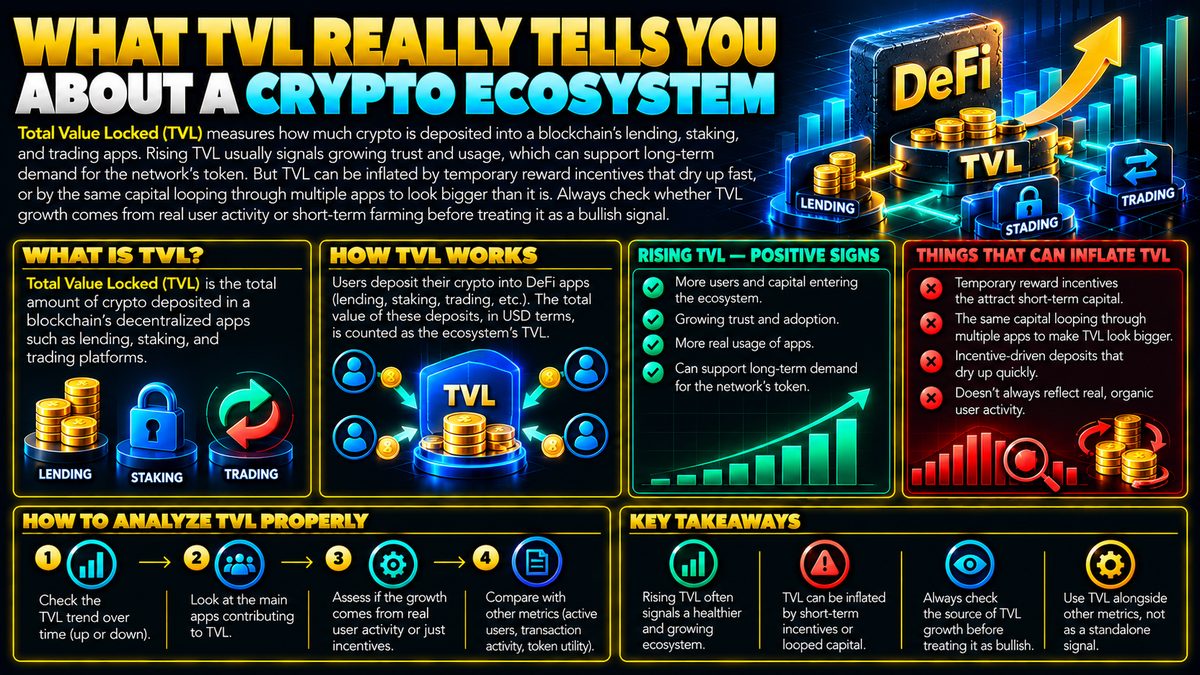
What TVL Means for a Crypto Ecosystem's Real Growth
Total Value Locked (TVL) measures how much crypto is deposited into a blockchain's lending, staking, and trading apps. Rising TVL usually signals growing trust and usage, which…
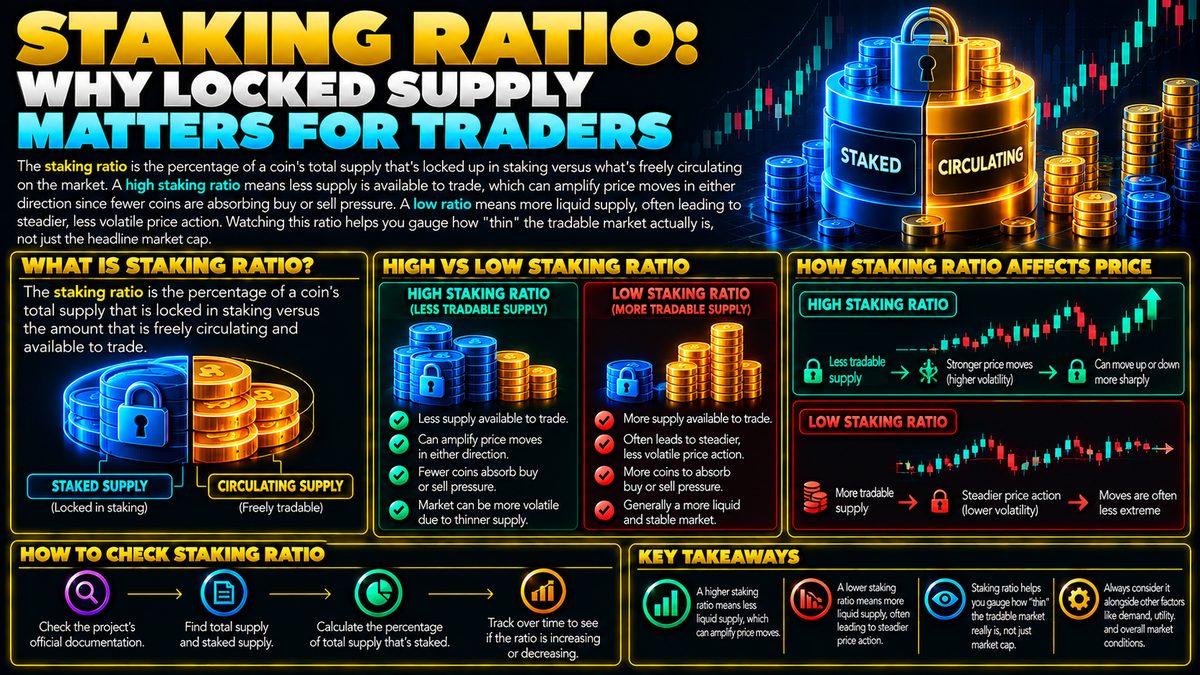
Staking Ratio: Why Locked Supply Matters for Traders
The staking ratio is the percentage of a coin's total supply that's locked up in staking versus what's freely circulating on the market. A high staking ratio means less supply is…
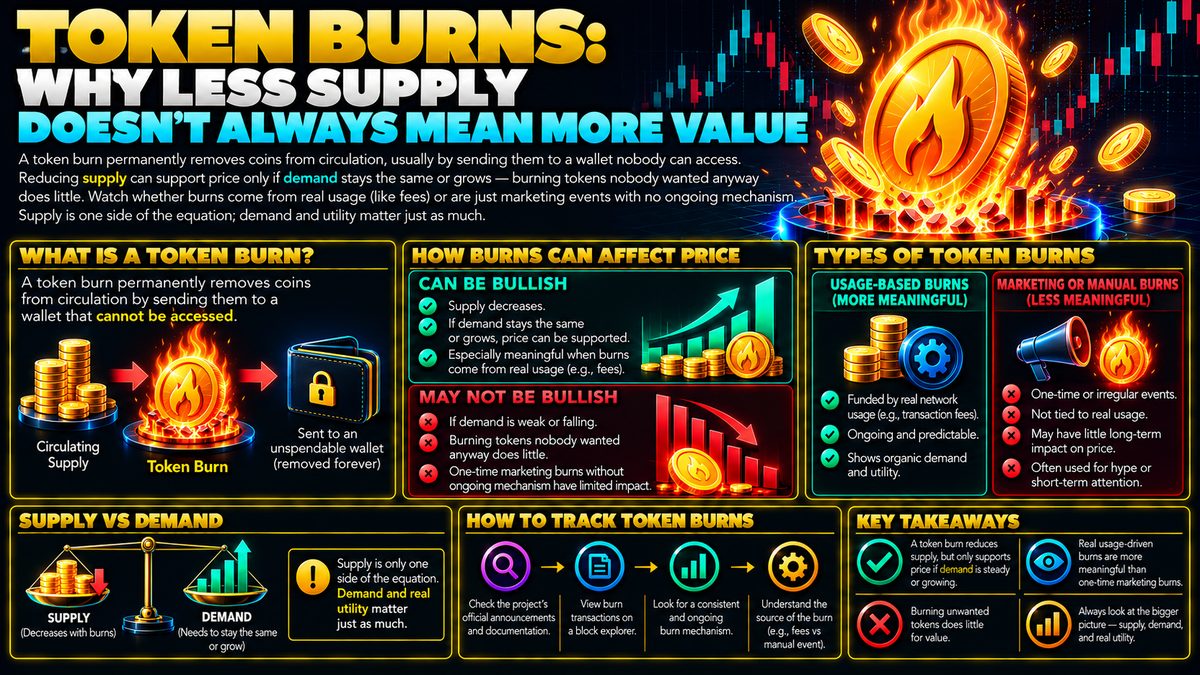
Token Burns Explained: Does Reducing Supply Increase Value?
A token burn permanently removes coins from circulation, usually by sending them to a wallet nobody can access. Reducing supply can support price only if demand stays the same or…
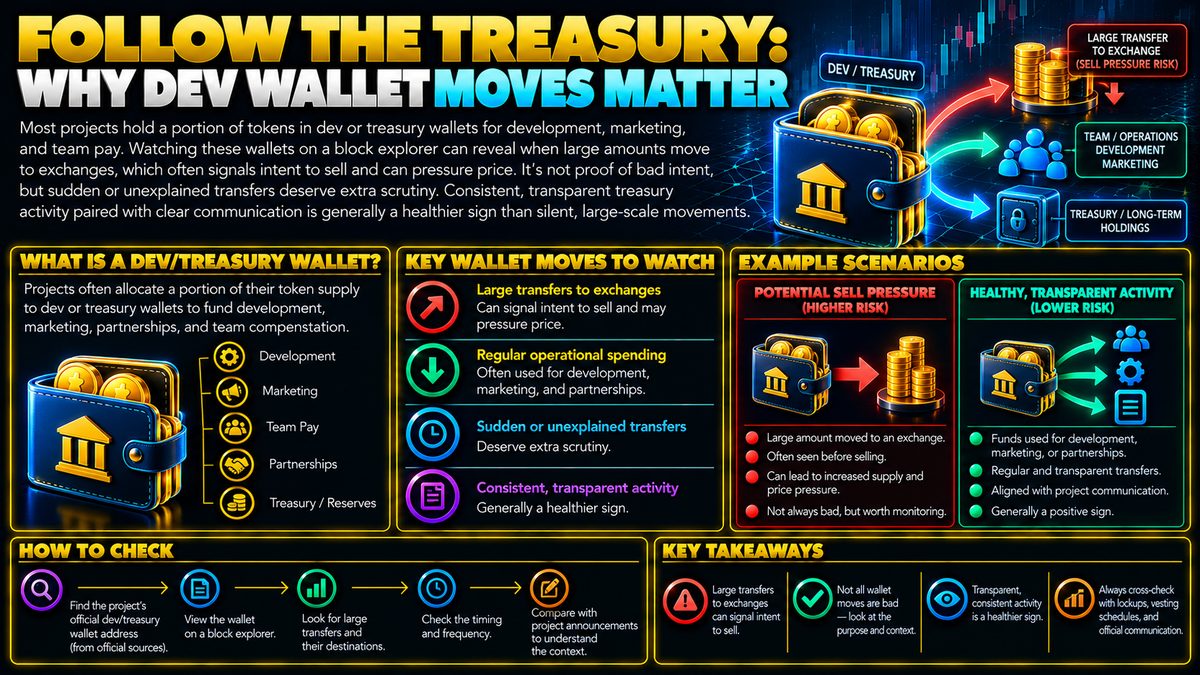
Dev Wallet Tracking: Why Treasury Moves Matter to Traders
Most projects hold a portion of tokens in dev or treasury wallets for development, marketing, and team pay. Watching these wallets on a block explorer can reveal when large…
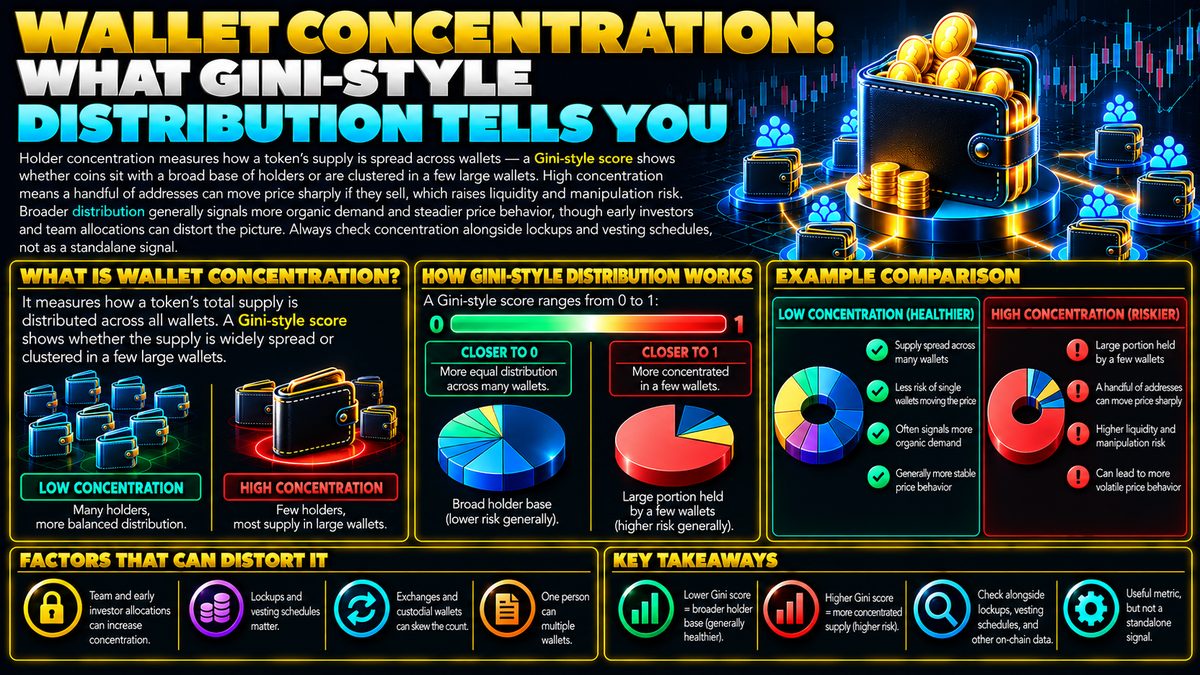
Wallet Concentration: What a Gini-Style Score Tells You
Holder concentration measures how a token's supply is spread across wallets — a Gini-style score shows whether coins sit with a broad base of holders or are clustered in a few…
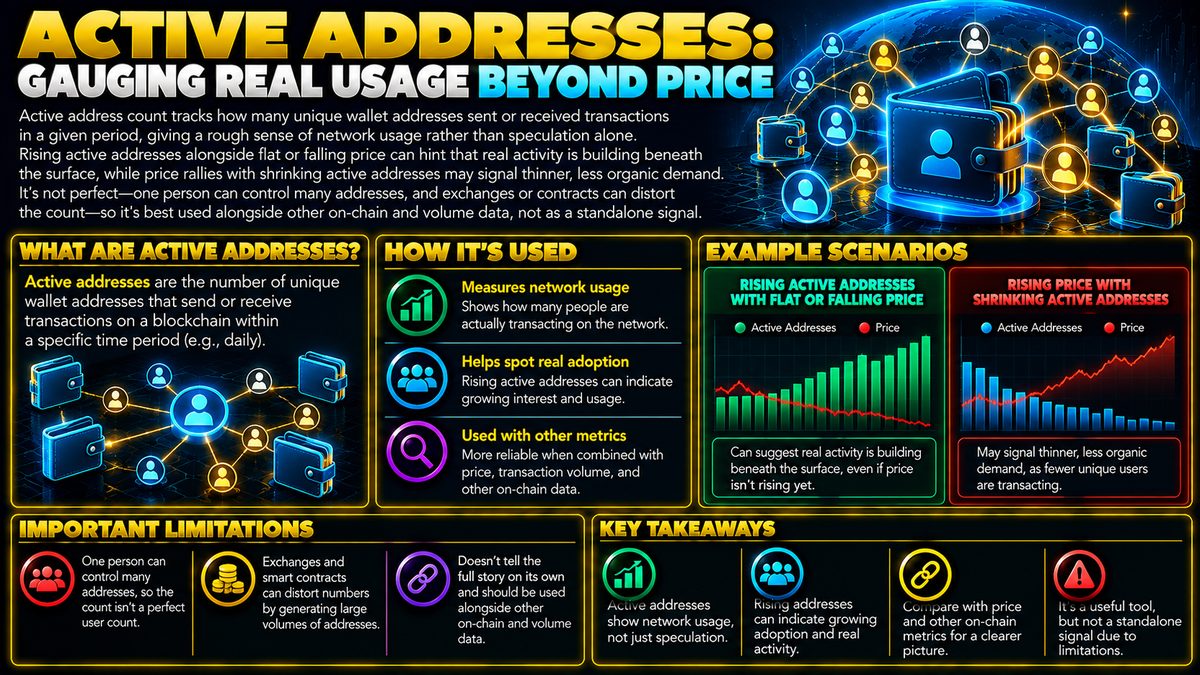
Active Addresses: What the On-Chain Metric Really Measures
Active address count tracks how many unique wallet addresses sent or received transactions in a given period, giving a rough sense of network usage rather than speculation alone.…
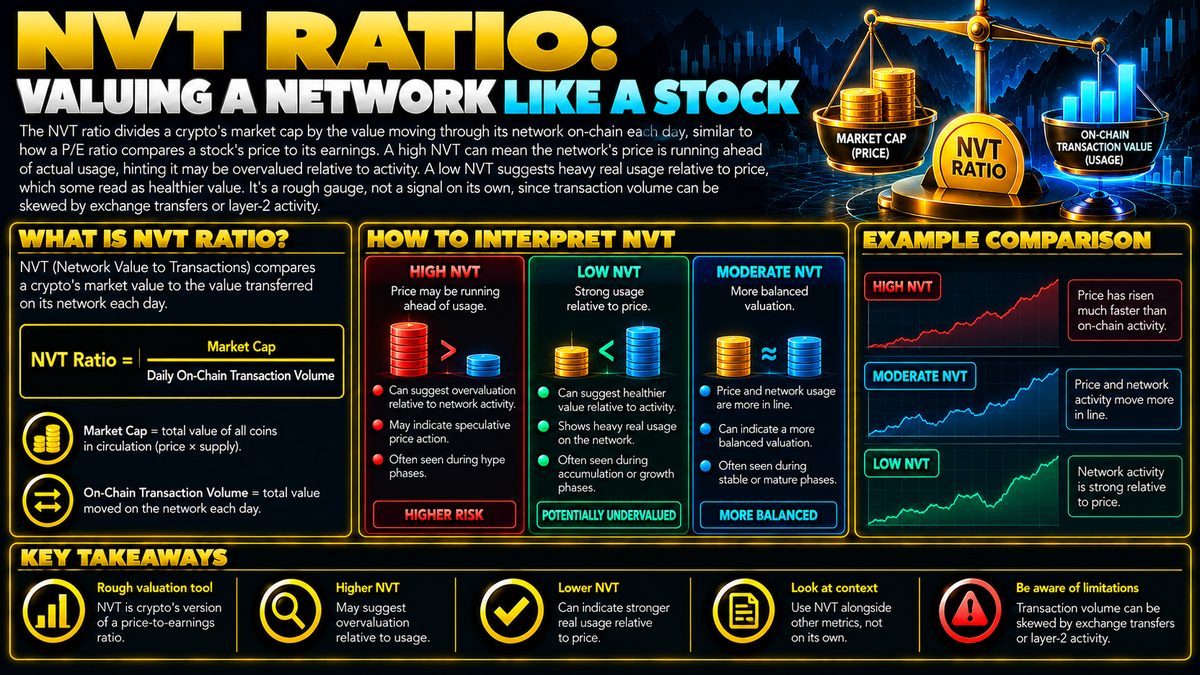
NVT Ratio: What It Is and How to Read It
The NVT ratio divides a crypto's market cap by the value moving through its network on-chain each day, similar to how a P/E ratio compares a stock's price to its earnings. A high…
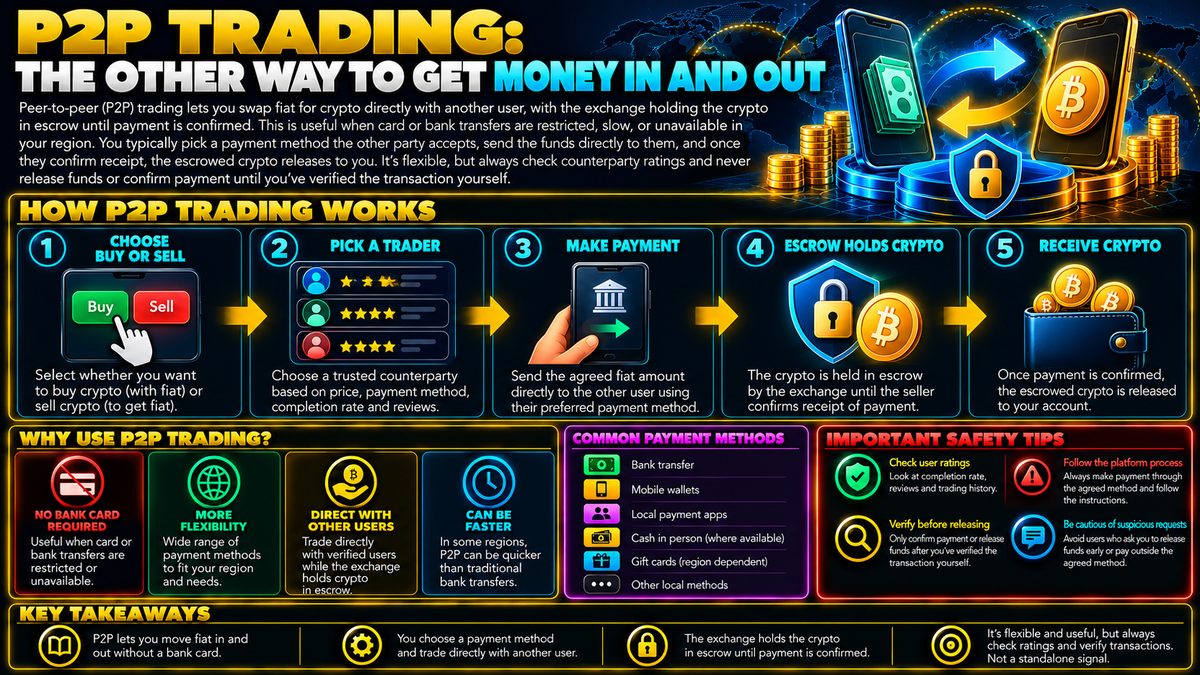
P2P Crypto Trading: What It Is and How It Works
Peer-to-peer (P2P) trading lets you swap fiat for crypto directly with another user, with the exchange holding the crypto in escrow until payment is confirmed. This is useful when…
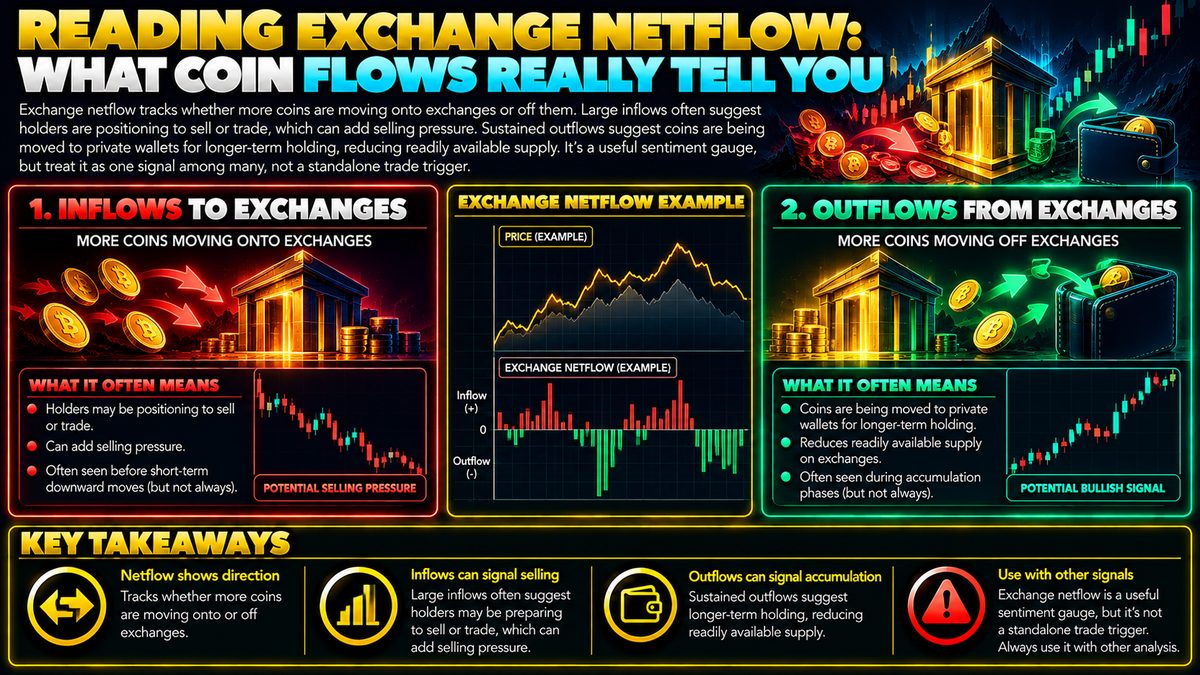
Exchange Netflow Explained: What Coin Flows Really Tell You
Exchange netflow tracks whether more coins are moving onto exchanges or off them. Large inflows often suggest holders are positioning to sell or trade, which can add selling…
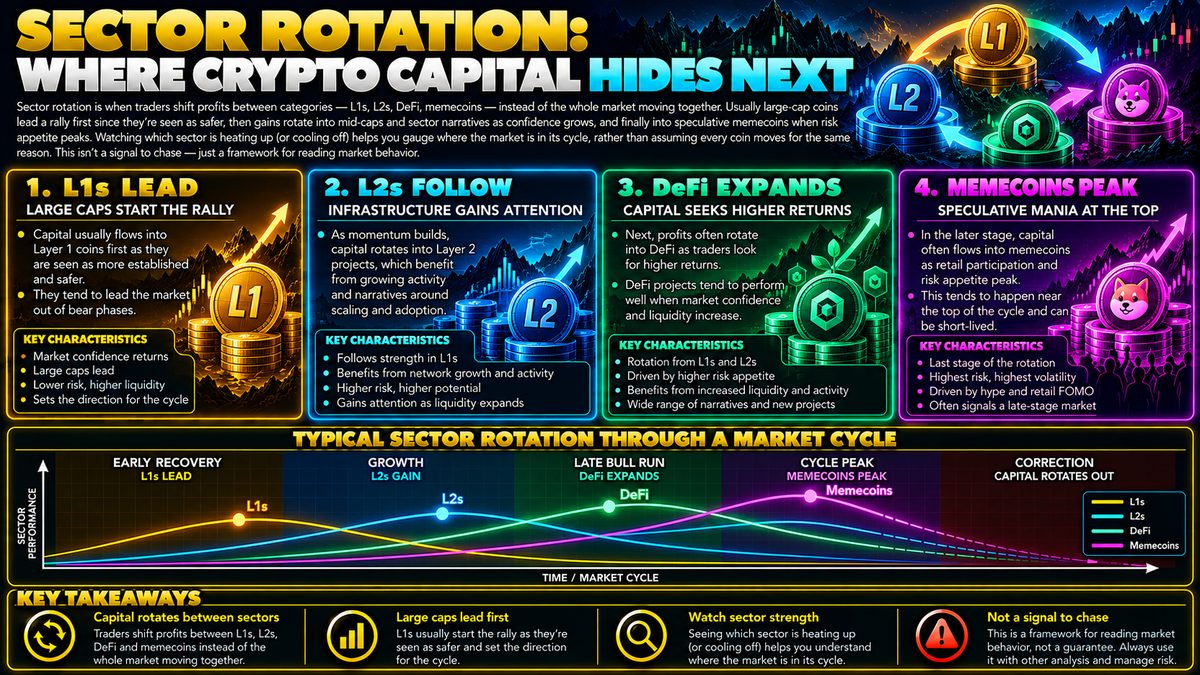
Sector Rotation Crypto: What It Means and How It Works
Sector rotation is when traders shift profits between categories — L1s, L2s, DeFi, memecoins — instead of the whole market moving together. Usually large-cap coins lead a rally…
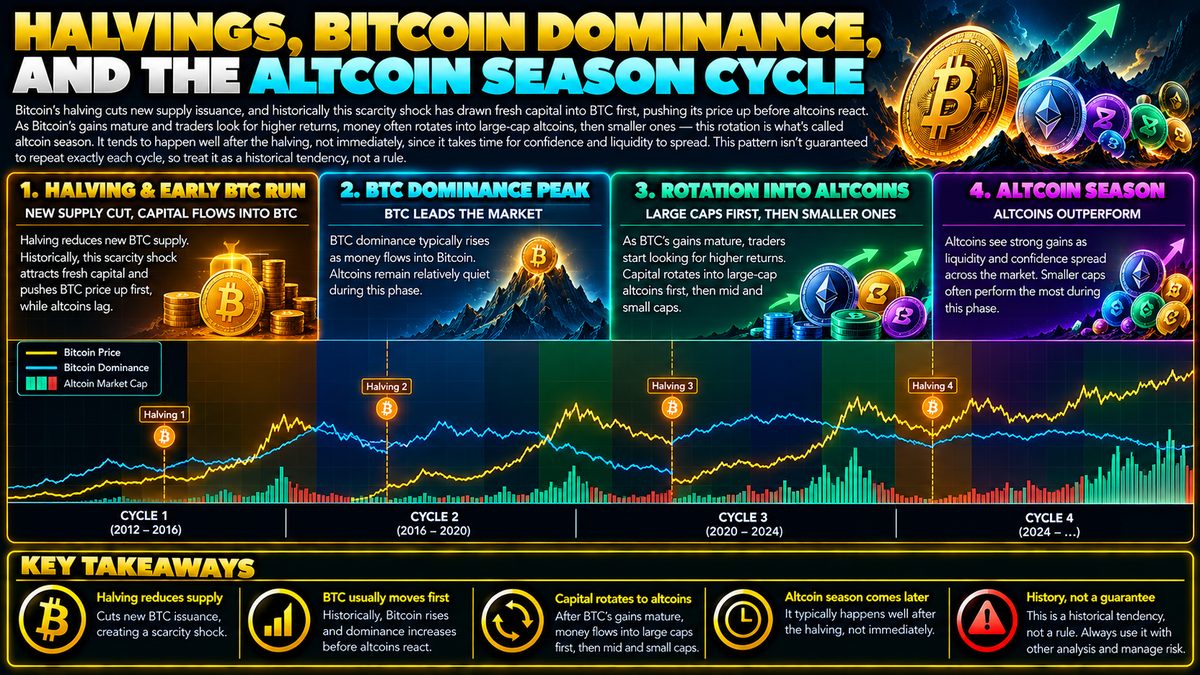
Bitcoin Halving and Altcoin Season: How the Rotation Works
Bitcoin's halving cuts new supply issuance, and historically this scarcity shock has drawn fresh capital into BTC first, pushing its price up before altcoins react. As Bitcoin's…
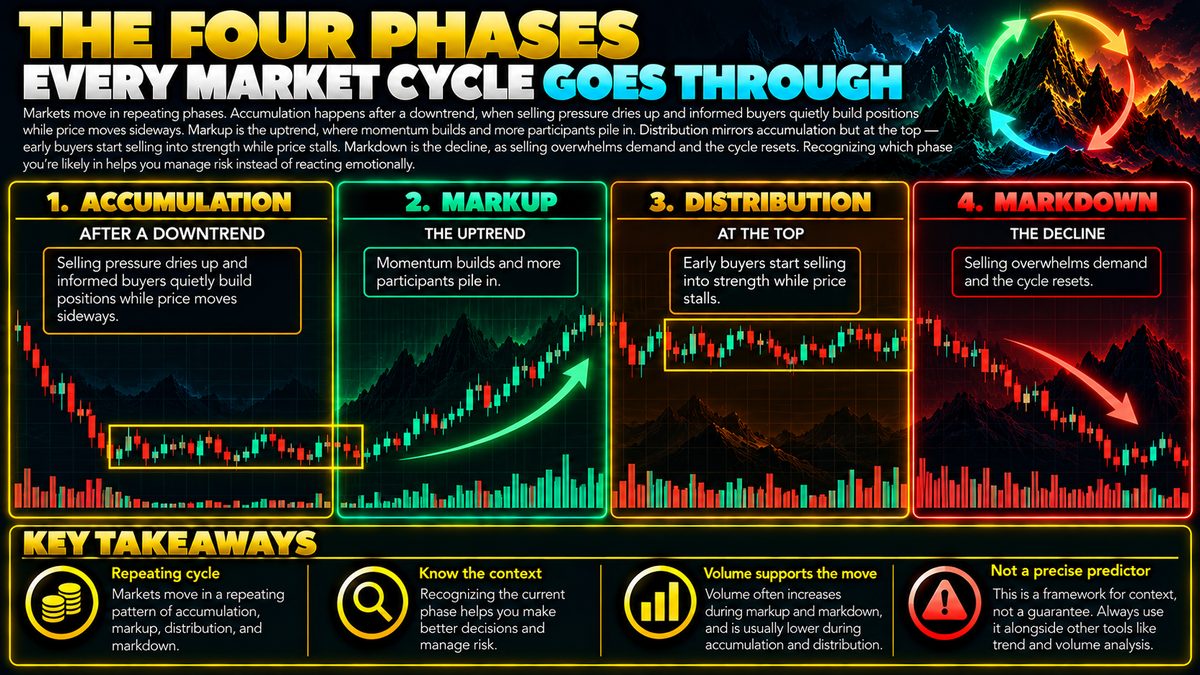
Market Cycle Phases: Accumulation, Markup, Distribution, Markdown
Markets move in repeating phases. Accumulation happens after a downtrend, when selling pressure dries up and informed buyers quietly build positions while price moves sideways.…
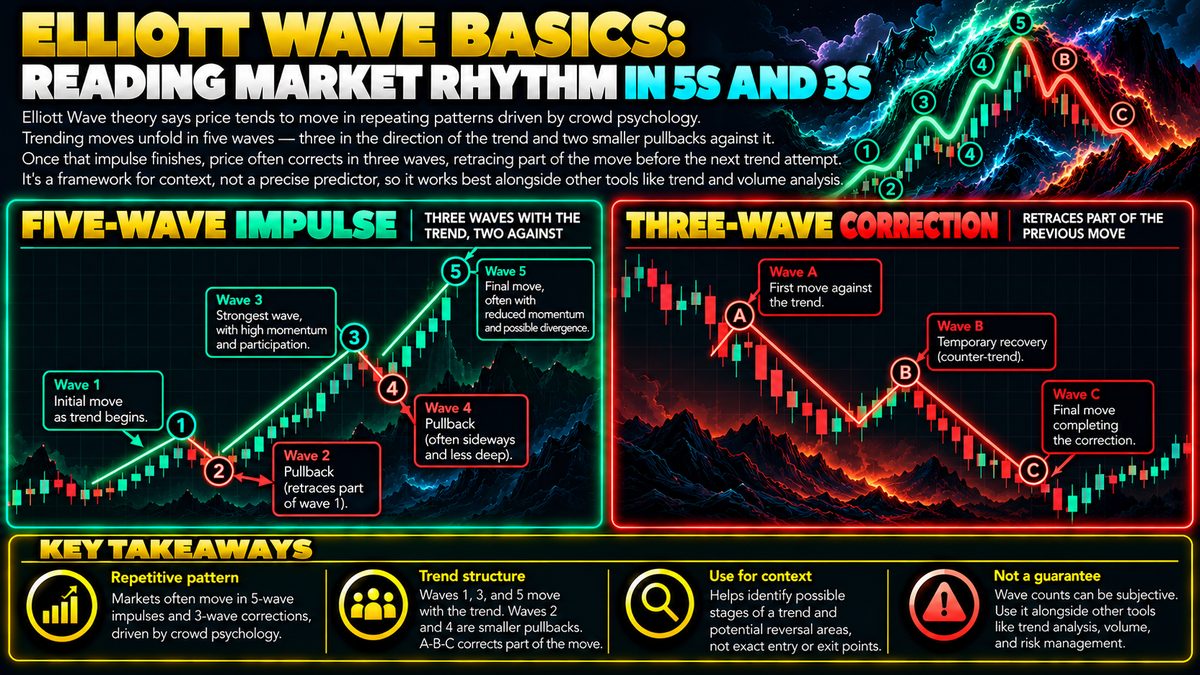
Elliott Wave Theory Basics: Reading Market Moves in 5-3 Patterns
Elliott Wave theory says price tends to move in repeating patterns driven by crowd psychology. Trending moves unfold in five waves — three in the direction of the trend and two…
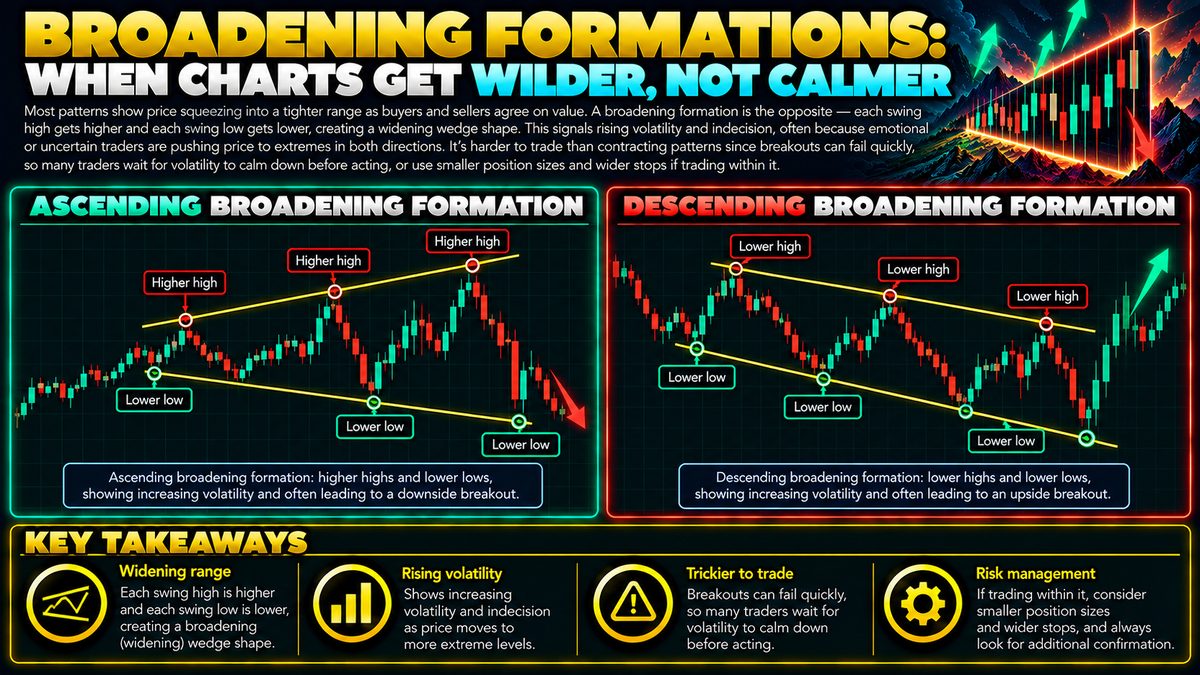
Broadening Formation Pattern: What It Means in Trading
Most patterns show price squeezing into a tighter range as buyers and sellers agree on value. A broadening formation is the opposite — each swing high gets higher and each swing…
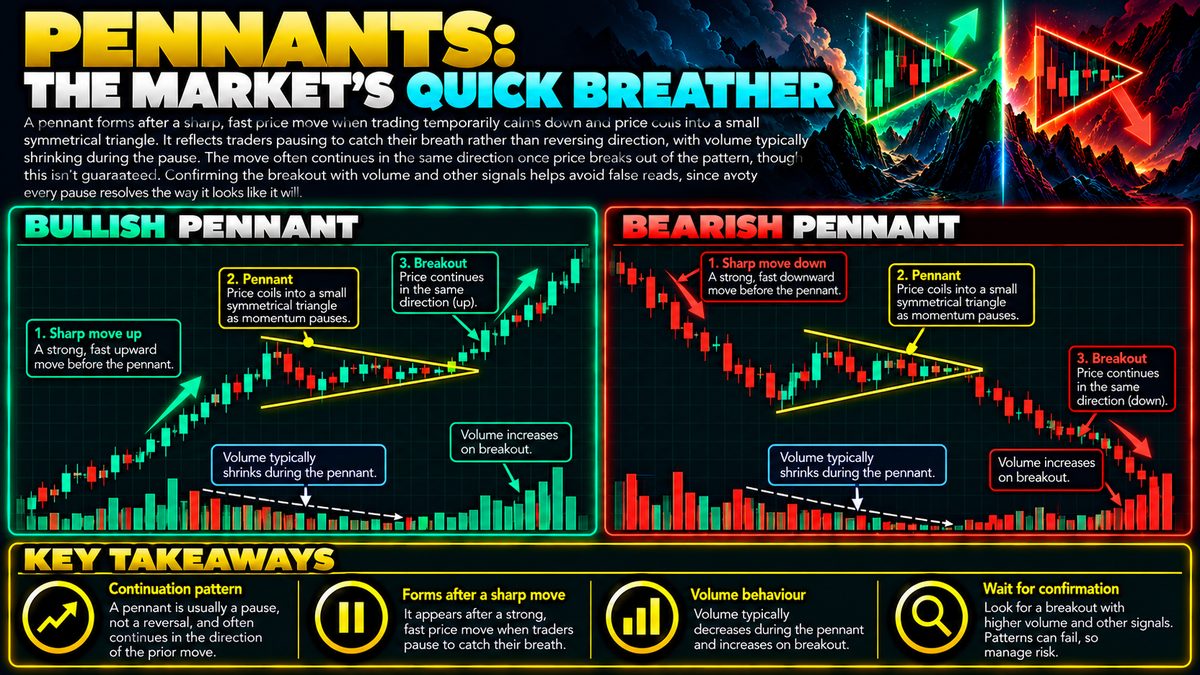
Pennant Pattern: What It Is and How Traders Read It
A pennant forms after a sharp, fast price move when trading temporarily calms down and price coils into a small symmetrical triangle. It reflects traders pausing to catch their…
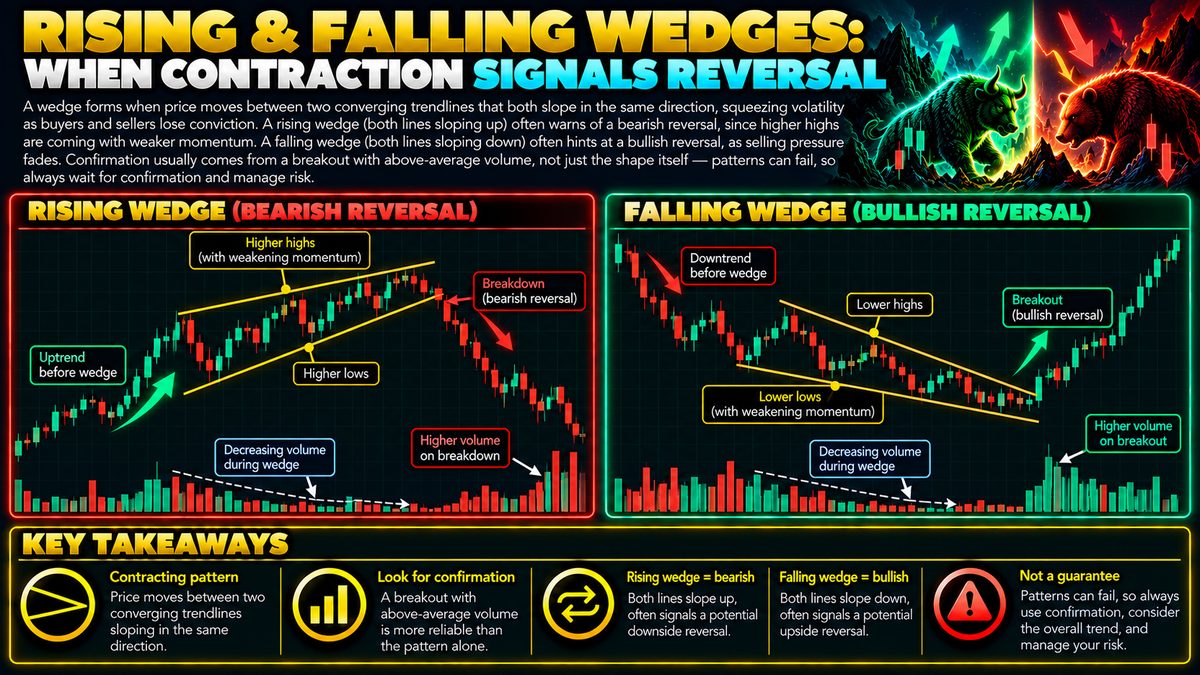
Rising vs Falling Wedge Patterns: What They Signal in Price Action
A wedge forms when price moves between two converging trendlines that both slope in the same direction, squeezing volatility as buyers and sellers lose conviction. A rising wedge…
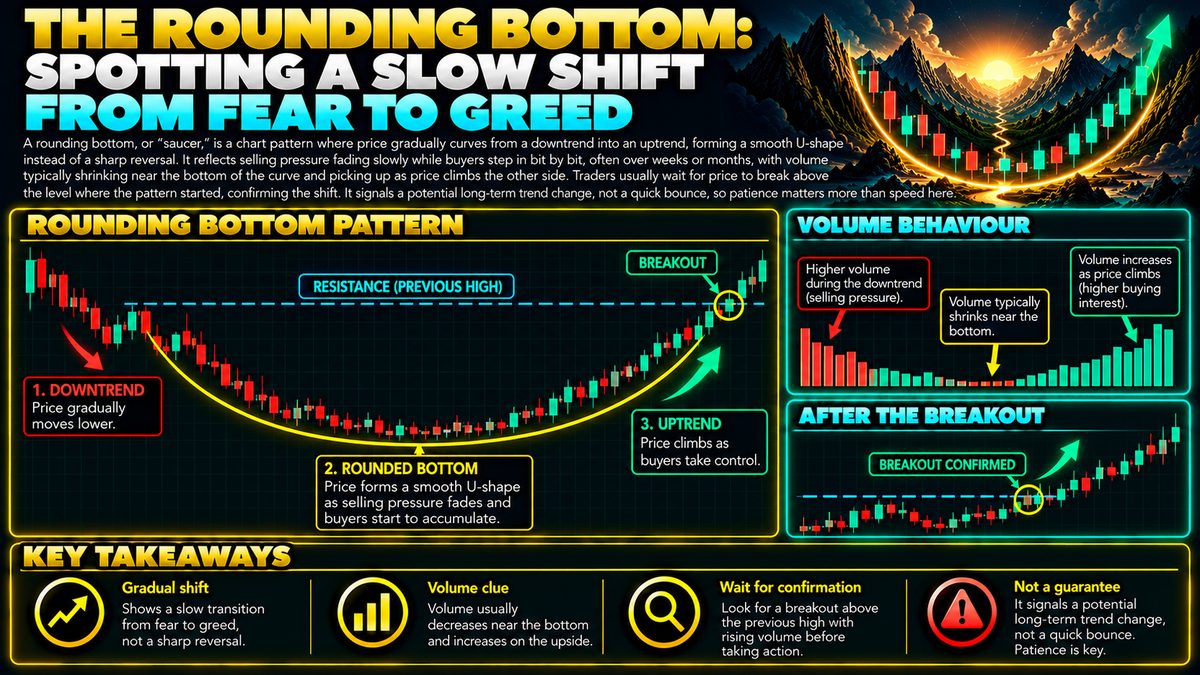
Rounding Bottom Pattern: What It Means and How to Trade It
A rounding bottom, or "saucer," is a chart pattern where price gradually curves from a downtrend into an uptrend, forming a smooth U-shape instead of a sharp reversal. It reflects…
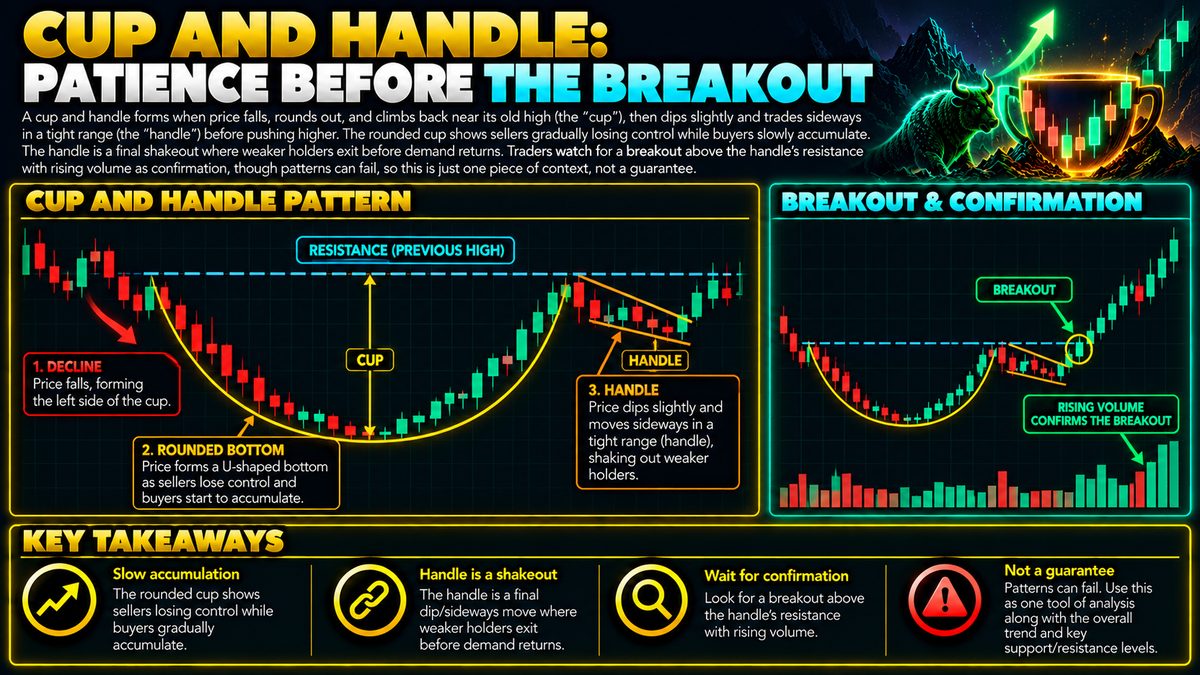
Cup and Handle Pattern: What It Means in Crypto Trading
A cup and handle forms when price falls, rounds out, and climbs back near its old high (the "cup"), then dips slightly and trades sideways in a tight range (the "handle") before…
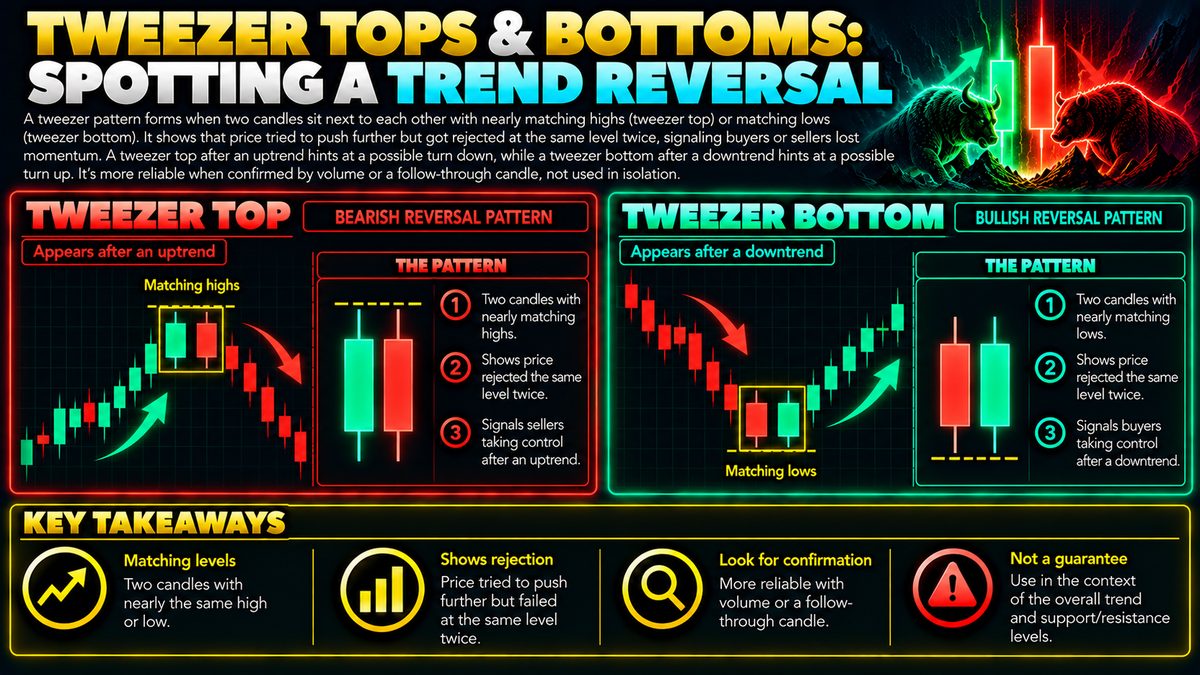
Tweezer Top and Bottom Candlestick Patterns Explained
A tweezer pattern forms when two candles sit next to each other with nearly matching highs (tweezer top) or matching lows (tweezer bottom). It shows that price tried to push…
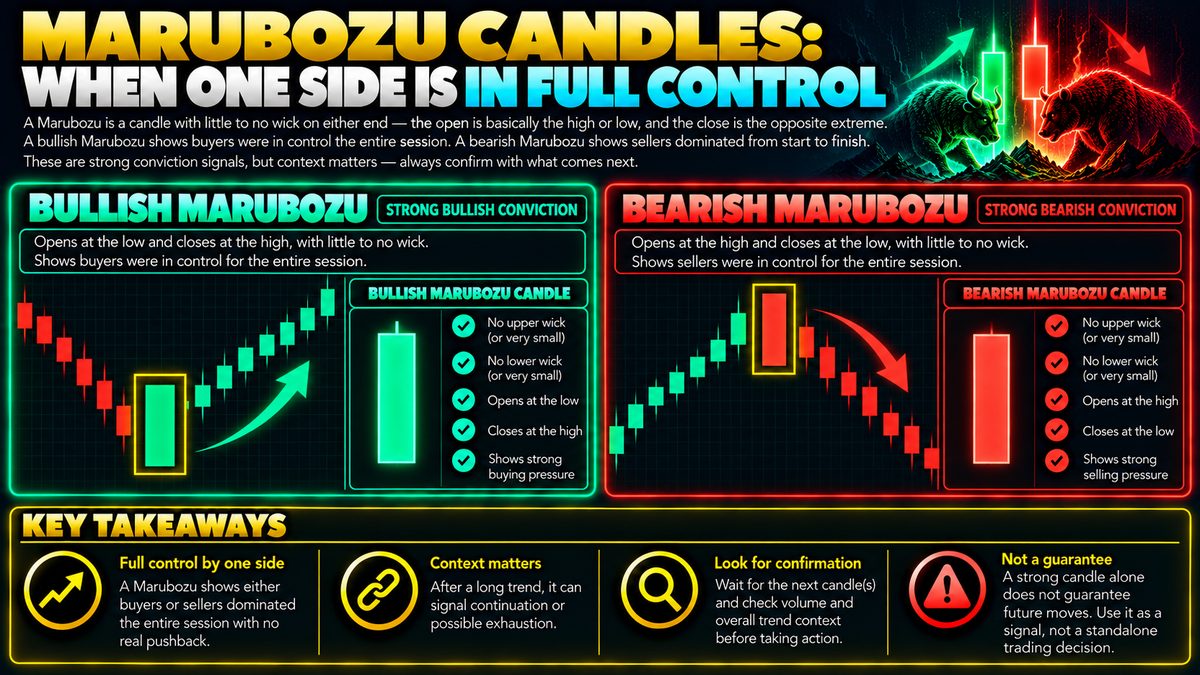
Marubozu Candlestick Pattern: What It Means and How to Read It
A Marubozu is a candle with little to no wick on either end — the open is basically the high or low, and the close is the opposite extreme. A bullish Marubozu opens at the low and…
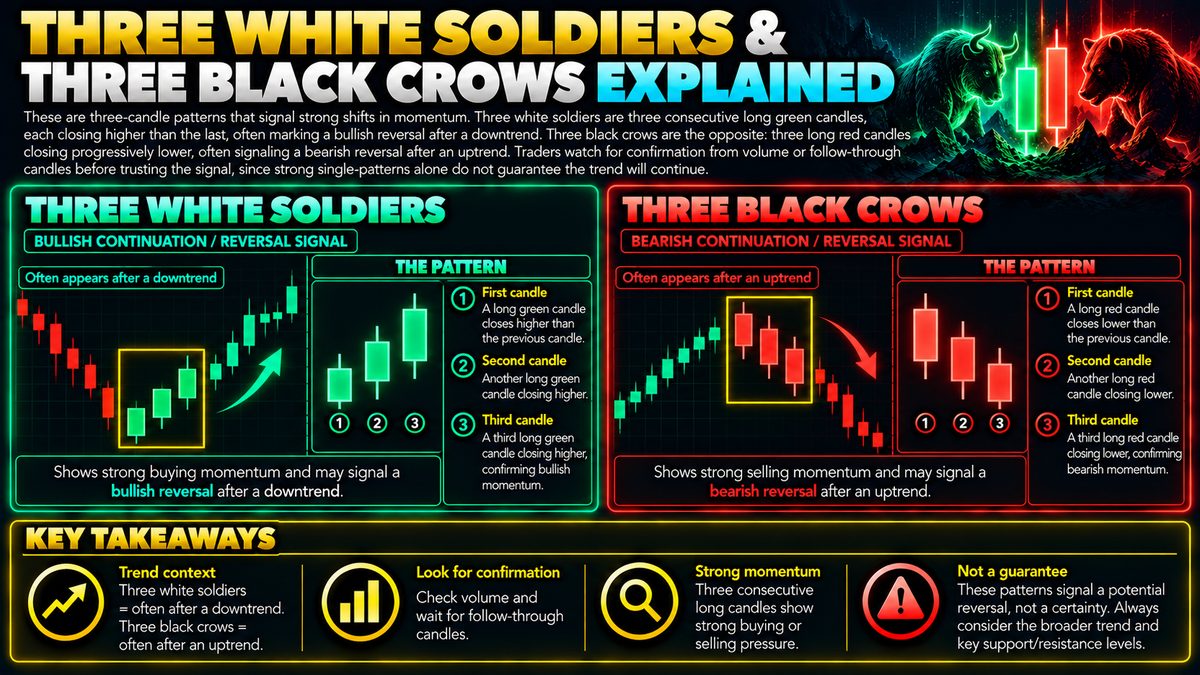
Three White Soldiers and Three Black Crows: What They Mean
These are three-candle patterns that signal strong shifts in momentum. Three white soldiers are three consecutive long green candles, each closing higher than the last, often…
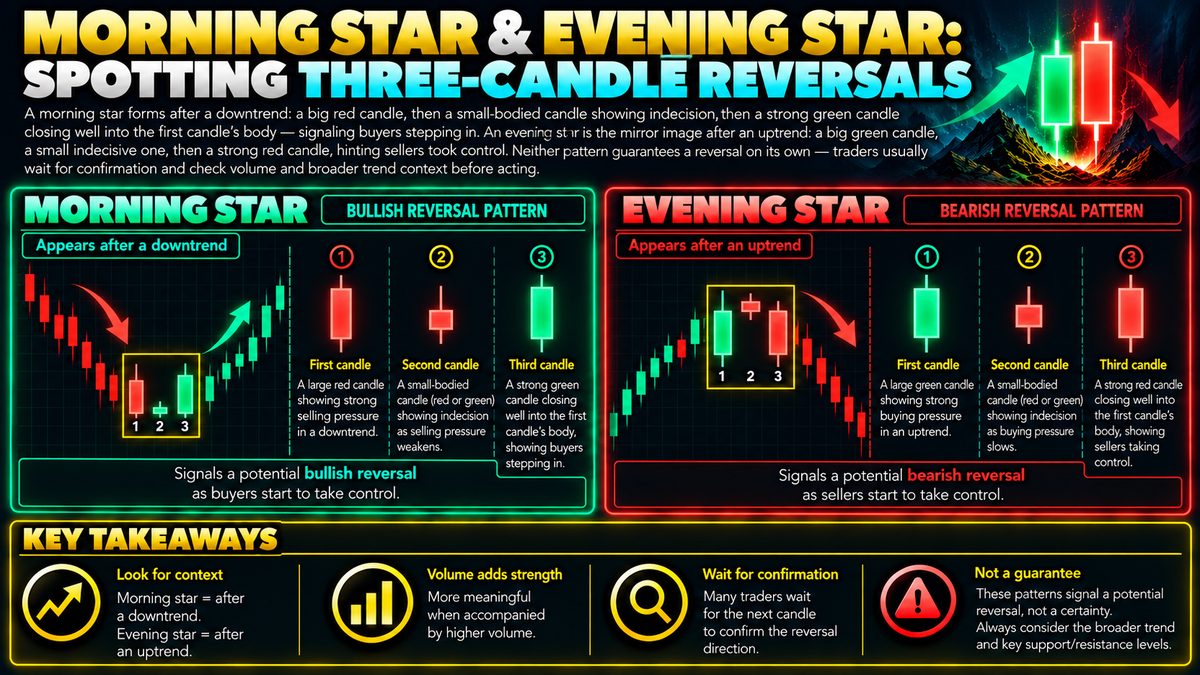
Morning Star and Evening Star Candlestick Patterns Explained
A morning star forms after a downtrend: a big red candle, then a small-bodied candle showing indecision, then a strong green candle closing well into the first candle's body —…
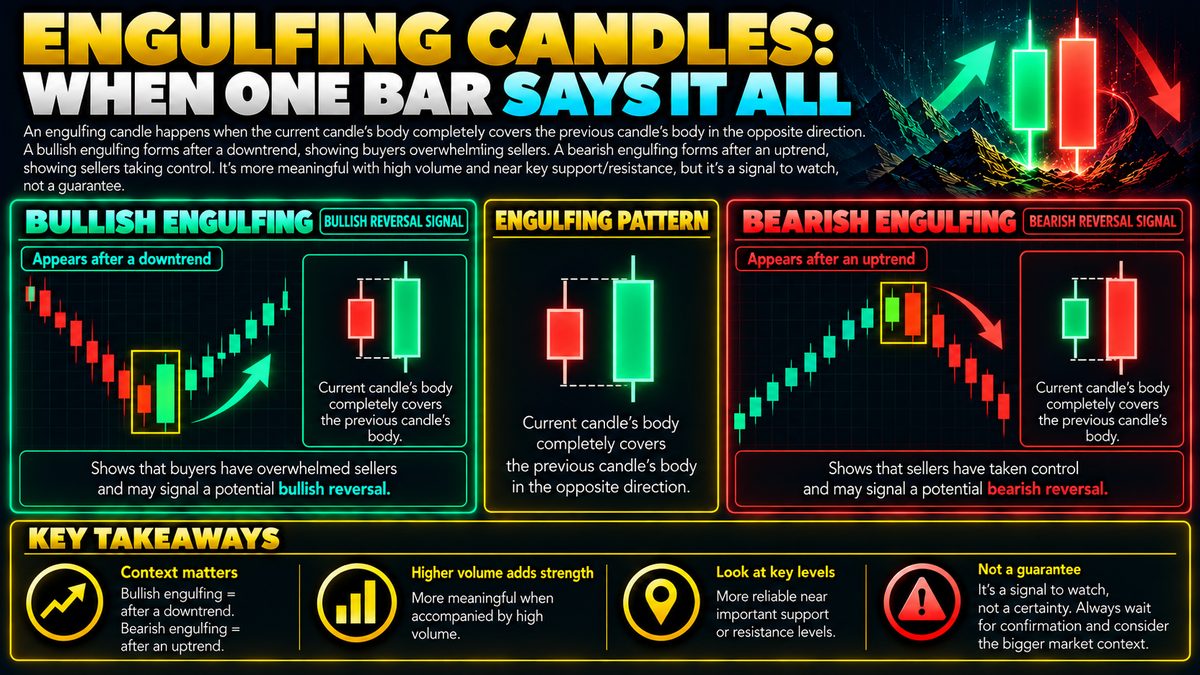
Engulfing Candle Pattern: What It Means and How to Read It
An engulfing candle happens when the current candle's body completely covers the previous candle's body in the opposite direction. A bullish engulfing forms after a downtrend,…
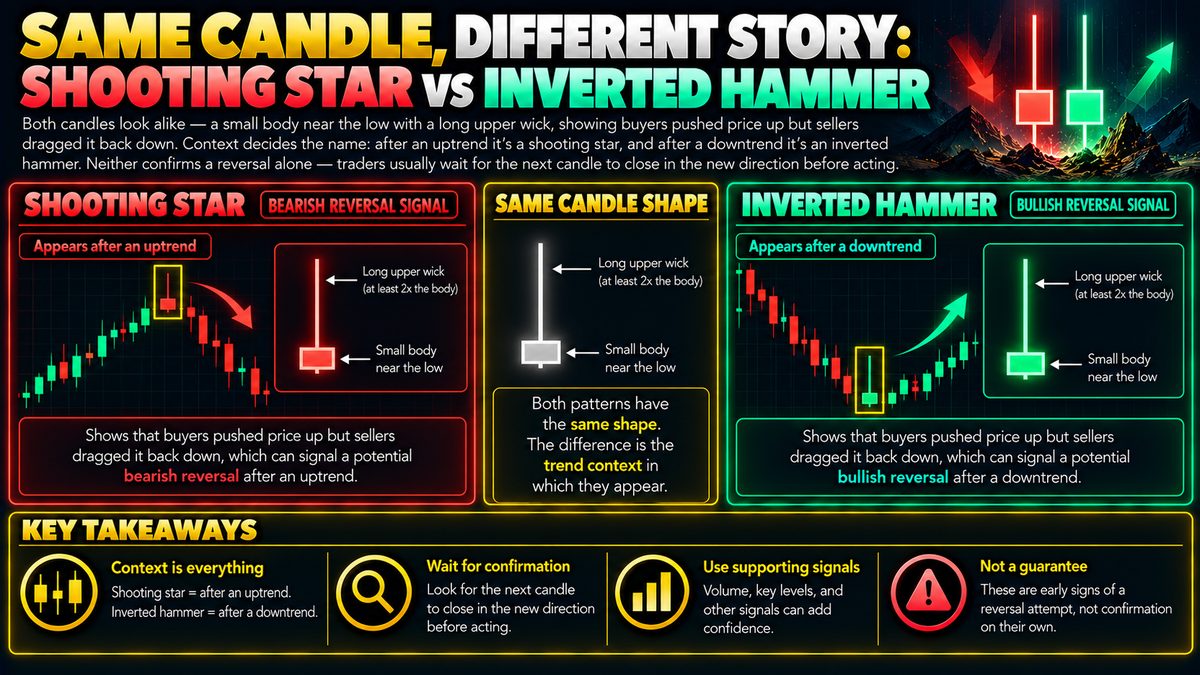
Shooting Star vs Inverted Hammer: Same Candle, Different Meaning
Both candles look alike — a small body near the low with a long upper wick, showing buyers pushed price up but sellers dragged it back down. Context decides the name: after an…
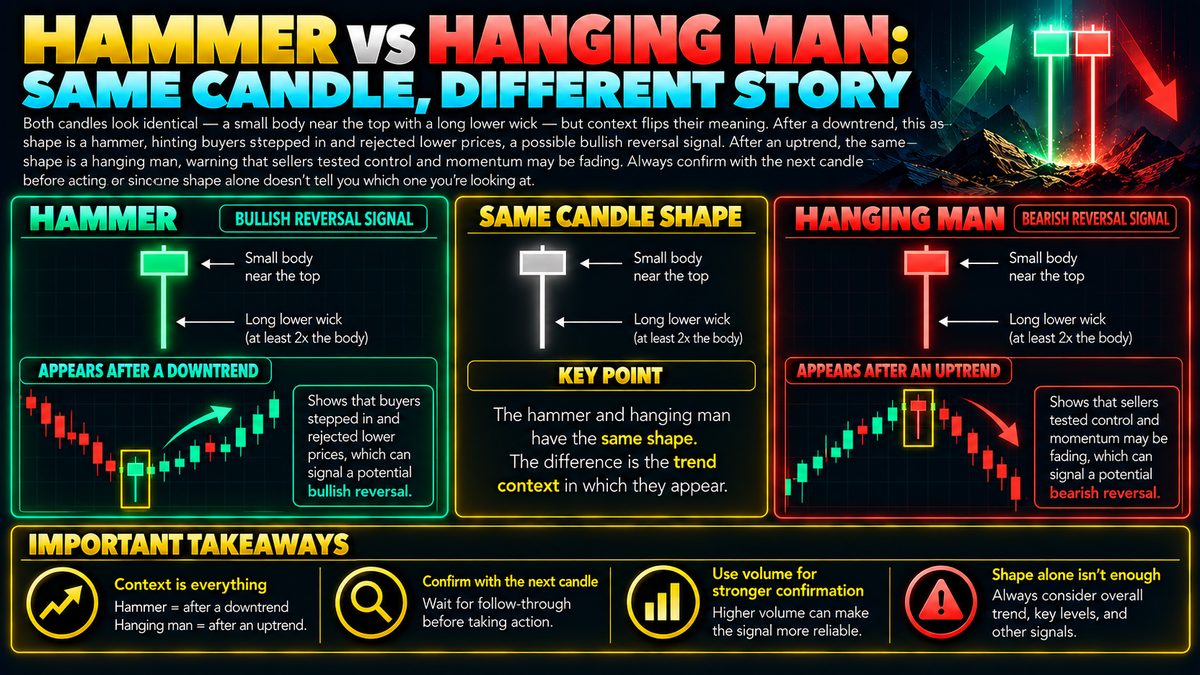
Hammer vs Hanging Man Candlestick: Key Differences
Both candles look identical — a small body near the top with a long lower wick — but context flips their meaning. After a downtrend, this shape is a hammer, hinting buyers stepped…
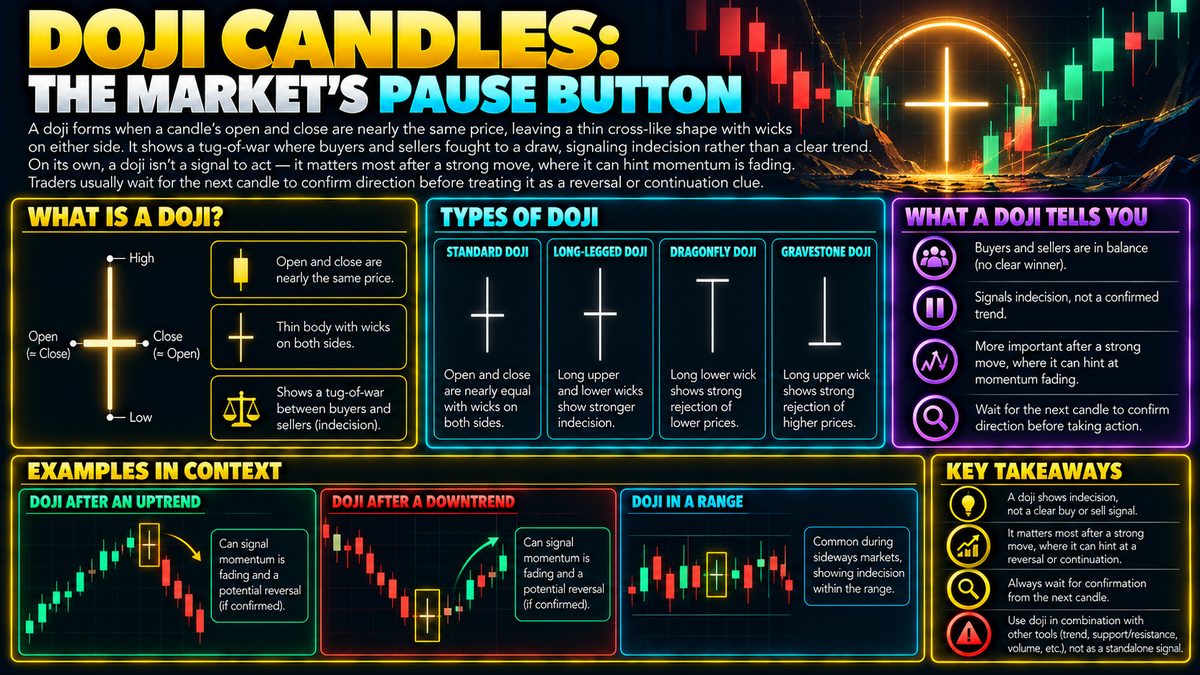
Doji Candlestick Pattern: What It Means and How to Trade It
A doji forms when a candle's open and close are nearly the same price, leaving a thin cross-like shape with wicks on either side. It shows a tug-of-war where buyers and sellers…
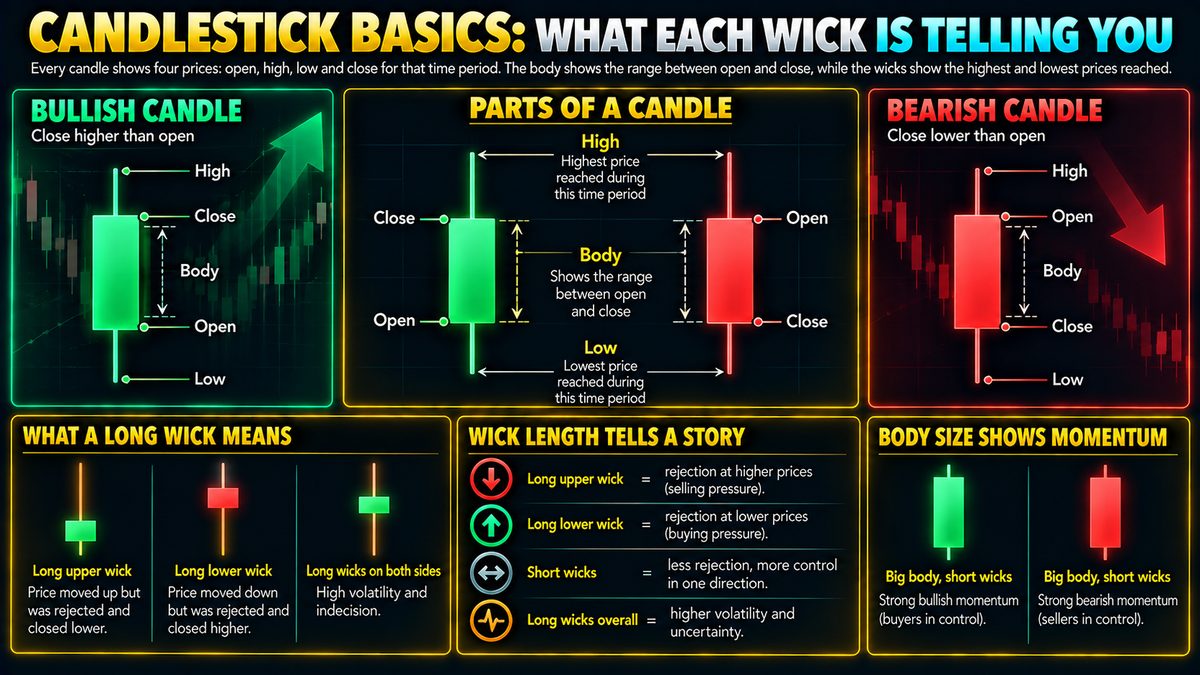
Candlestick Wicks Explained: What They Tell You About Price
Every candle shows four prices: open, high, low, and close for that time period. The thick part (the "body") shows the range between open and close, while the thin lines ("wicks")…

Anti-Phishing Code: What It Is and How to Set One Up
An anti-phishing code is a custom word or phrase you set in your account, which then appears in every genuine email the platform sends you. If an email claiming to be from them is…

How to Spot Phishing Scams in Crypto
Phishing scams trick you into entering your login or seed phrase on a fake website that looks identical to a real exchange or wallet. Attackers spread these links via fake ads,…
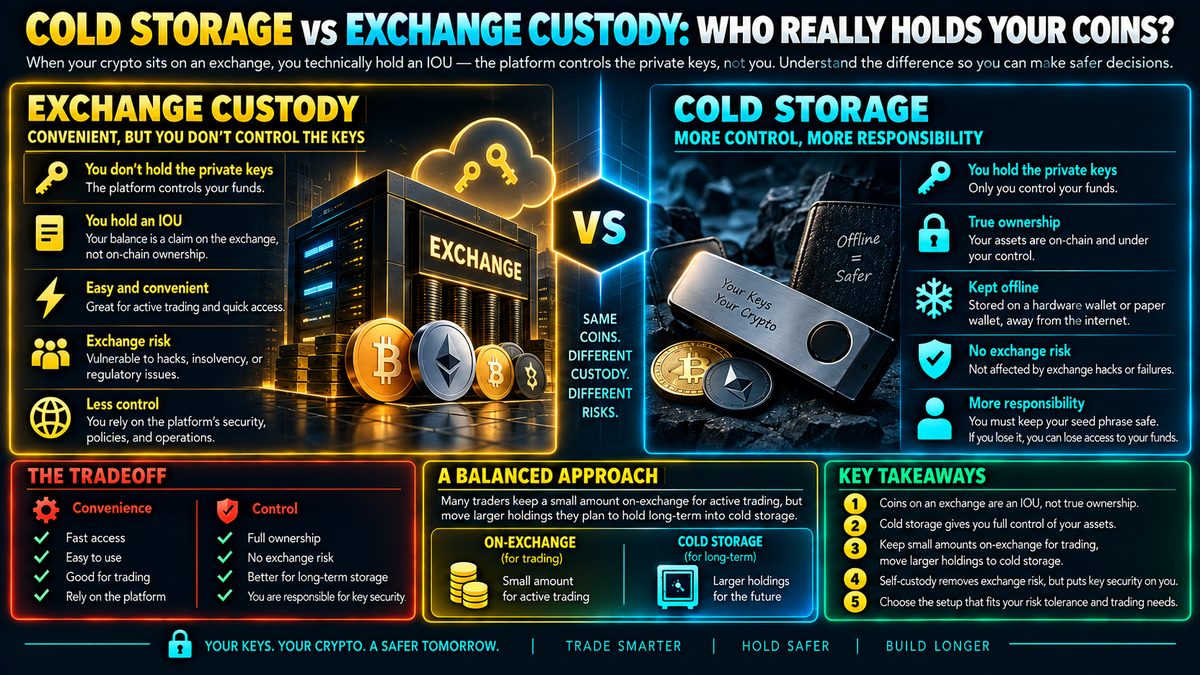
Cold Storage vs Exchange Custody: Who Holds Your Crypto Keys
When your crypto sits on an exchange, you technically hold an IOU — the platform controls the private keys, not you. Cold storage means moving assets to a wallet where only you…
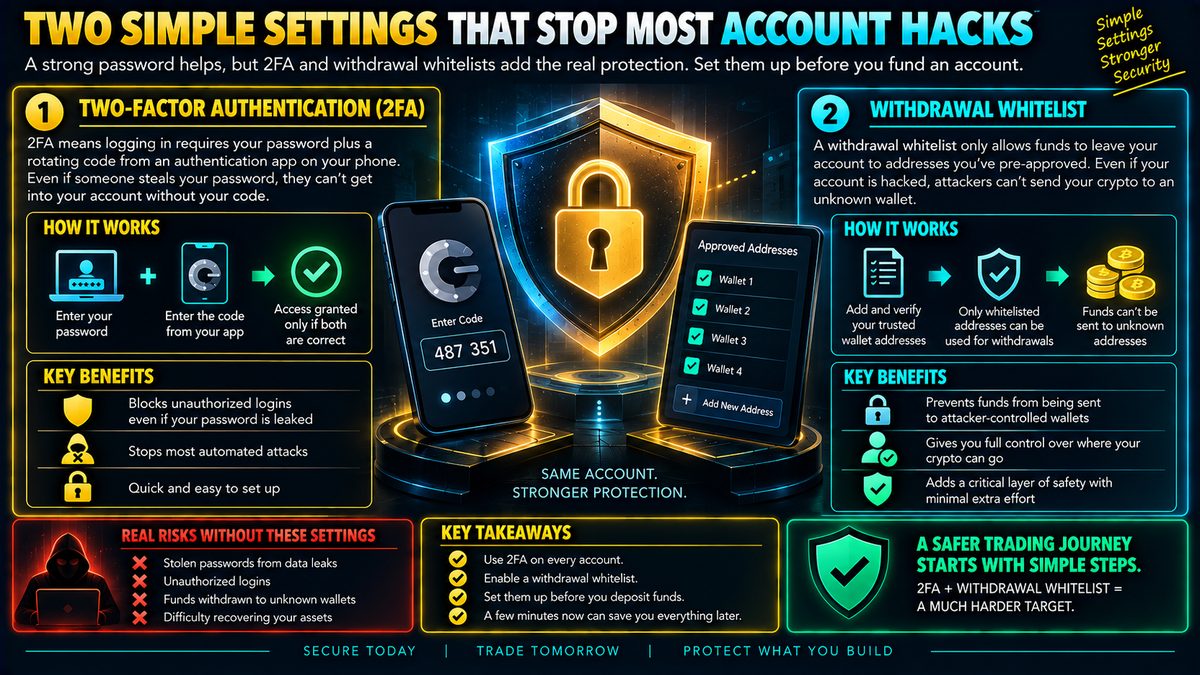
2FA and Withdrawal Whitelist: Two Settings That Stop Account Hacks
2FA (two-factor authentication) means logging in requires your password plus a rotating code from an app on your phone, so a stolen password alone can't get someone into your…
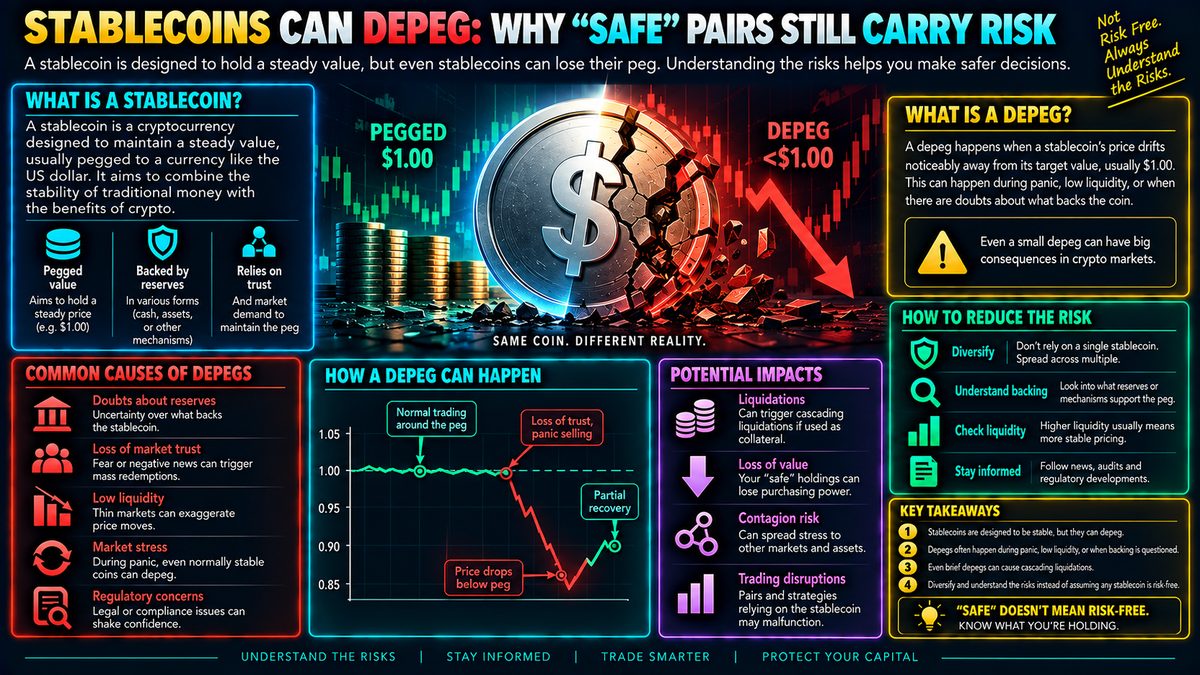
Stablecoin Depeg Risk: Why Safe Pairs Still Carry Risk
A stablecoin is designed to hold a steady value, usually pegged to a currency like the dollar, but that peg relies on reserves, trust, and market demand staying balanced. A depeg…
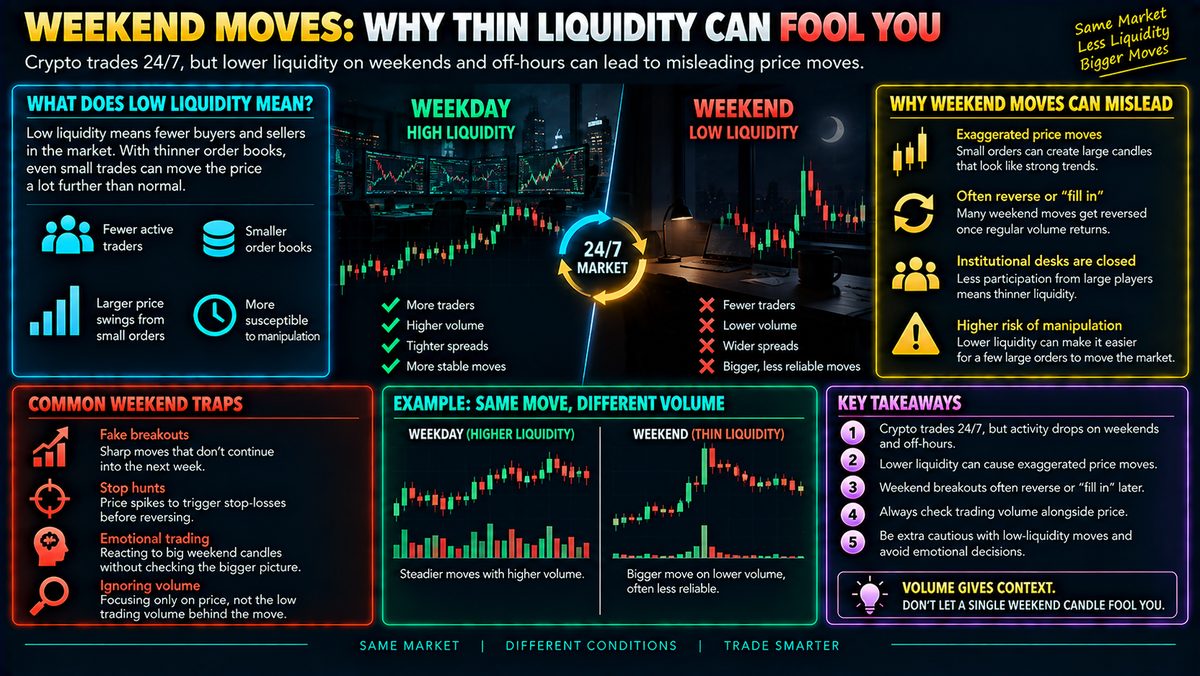
Weekend Crypto Price Moves: Why Thin Liquidity Can Mislead Traders
Crypto trades 24/7, but real trading activity drops sharply on weekends and during off-hours when institutional desks are closed. With fewer buyers and sellers, even small orders…
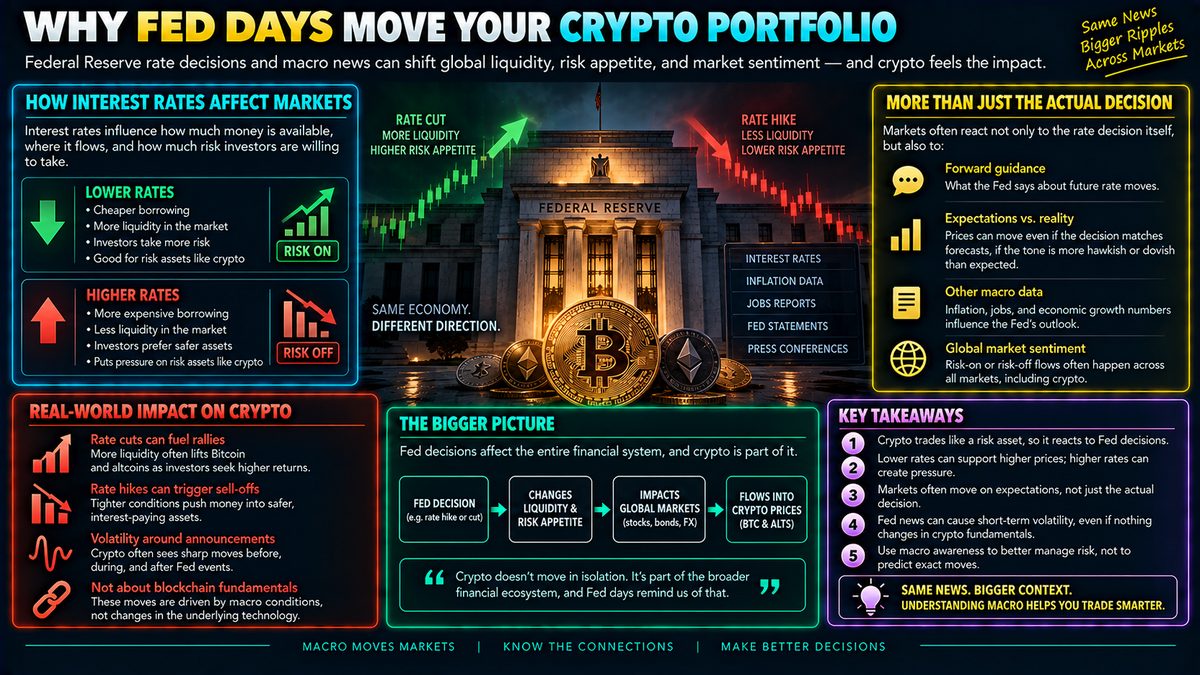
Why Fed Interest Rate Decisions Move Crypto Prices
Crypto trades like a risk asset, so when the Fed raises or cuts interest rates, it changes how much money is chasing returns. Lower rates make cheap borrowing easier, pushing…
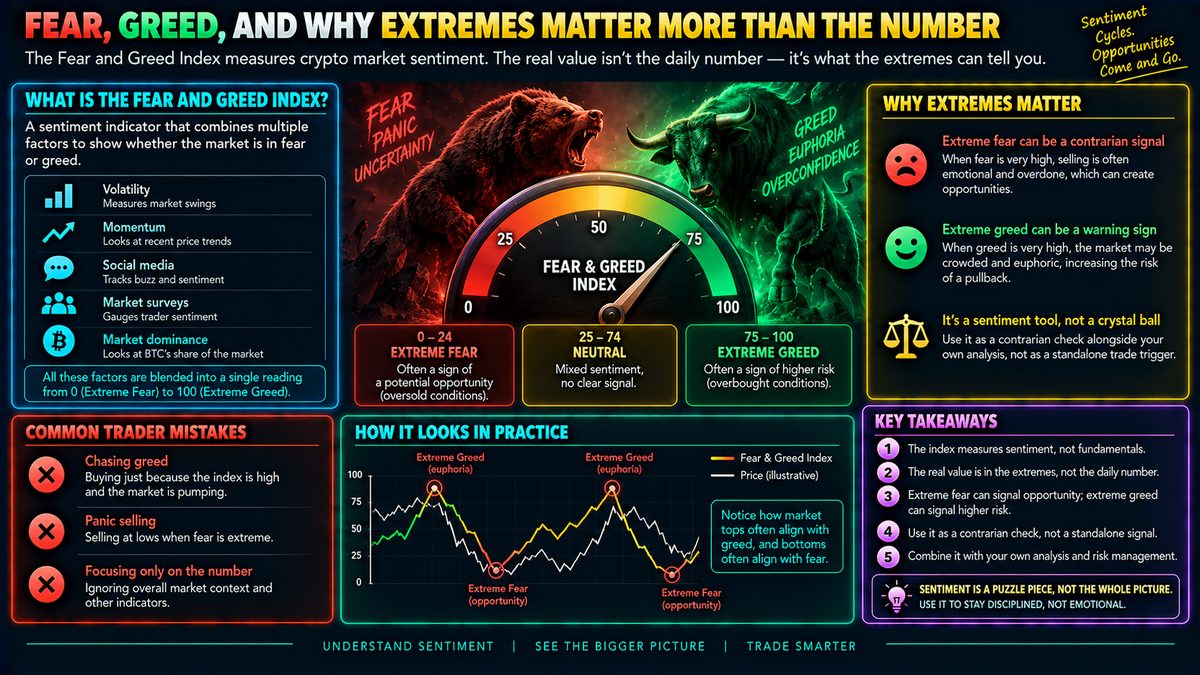
Fear and Greed Index: Why Extremes Matter More Than the Number
The Fear and Greed Index blends things like volatility, momentum, and social buzz into one sentiment reading. The real value isn't the daily number — it's the extremes. Extreme…
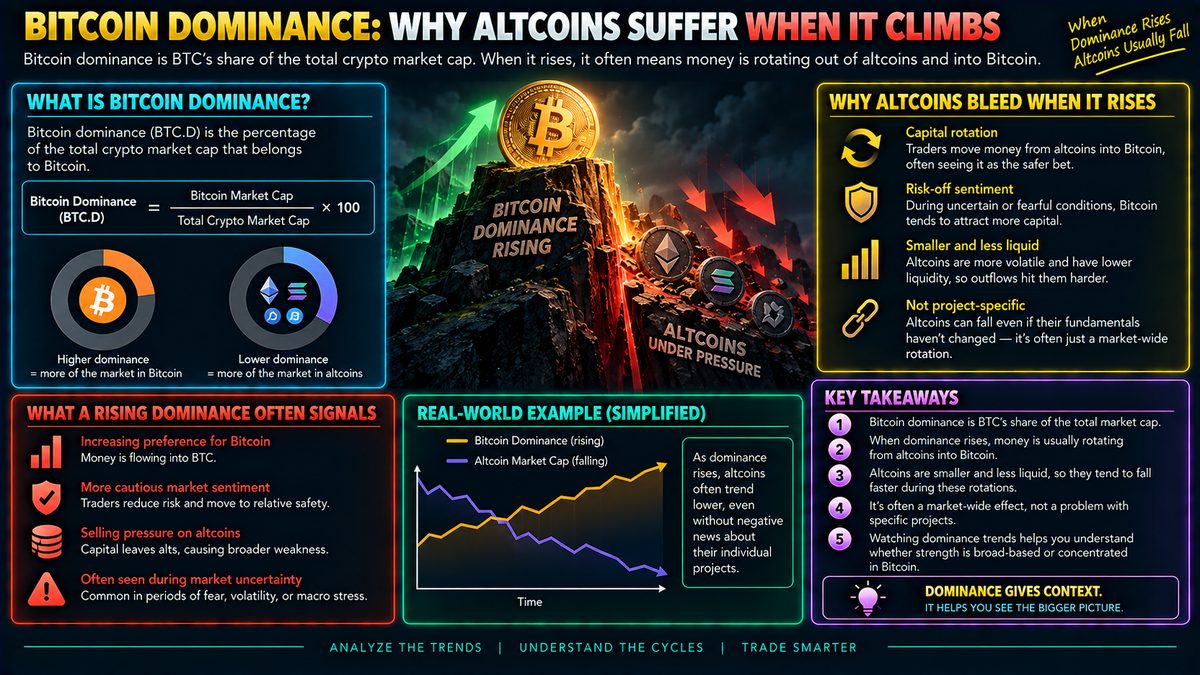
Bitcoin Dominance: Why Altcoins Suffer When It Climbs
Bitcoin dominance is simply BTC's share of the total crypto market cap. When it rises, it usually means money is rotating out of altcoins and into Bitcoin, often because traders…
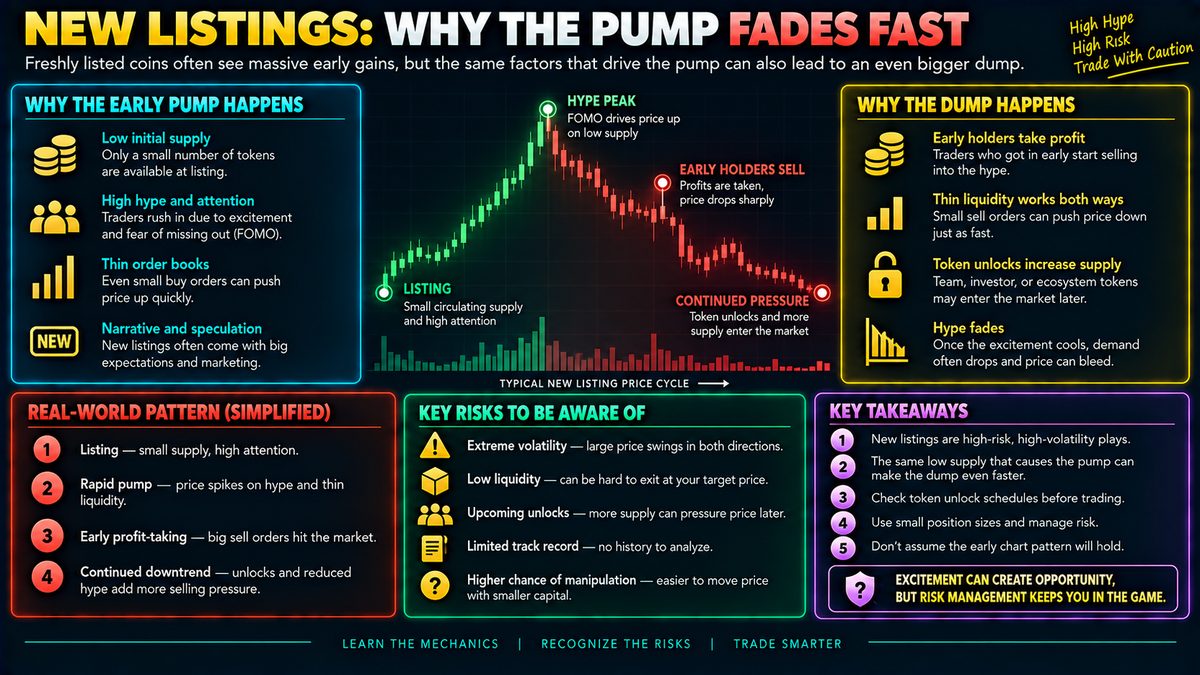
New Listings: Why the Early Pump Often Fades Fast
When a coin first lists, supply is tiny and early buyers are often driven by hype or fear of missing out, so price can spike quickly on thin order books. That same thin liquidity…
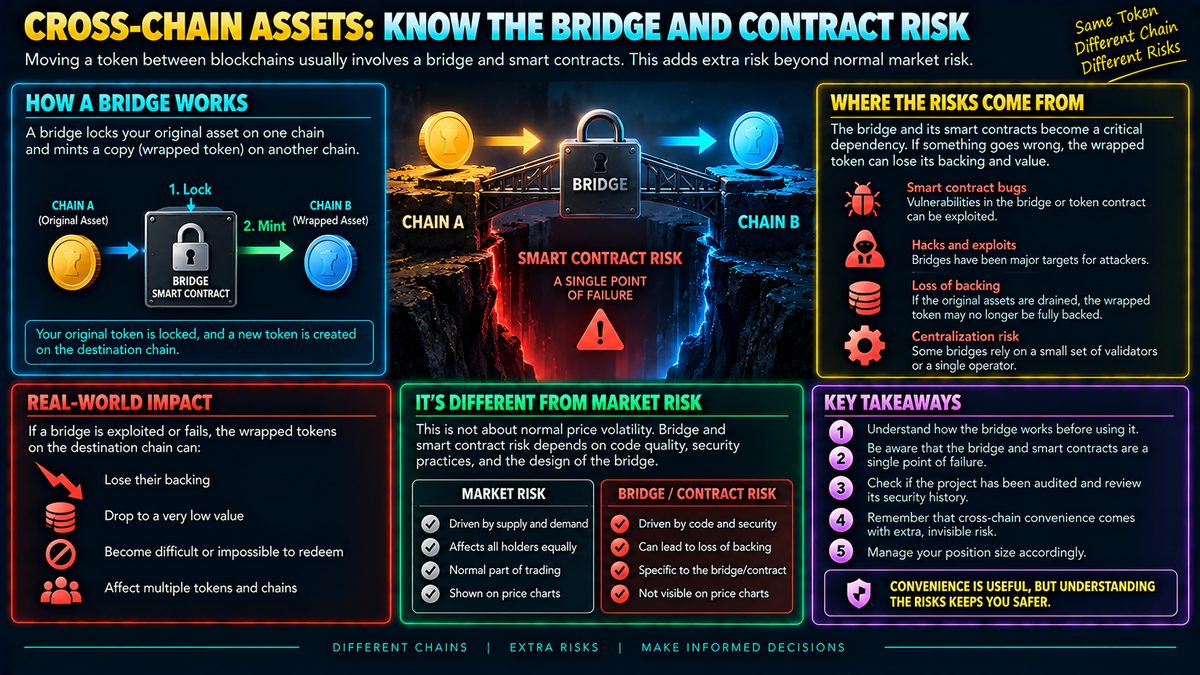
Cross-Chain Bridge Risk: What Happens If the Contract Fails
When you move a token from one blockchain to another, you're usually using a "bridge" — a smart contract that locks your original asset and mints a copy on the new chain. That…
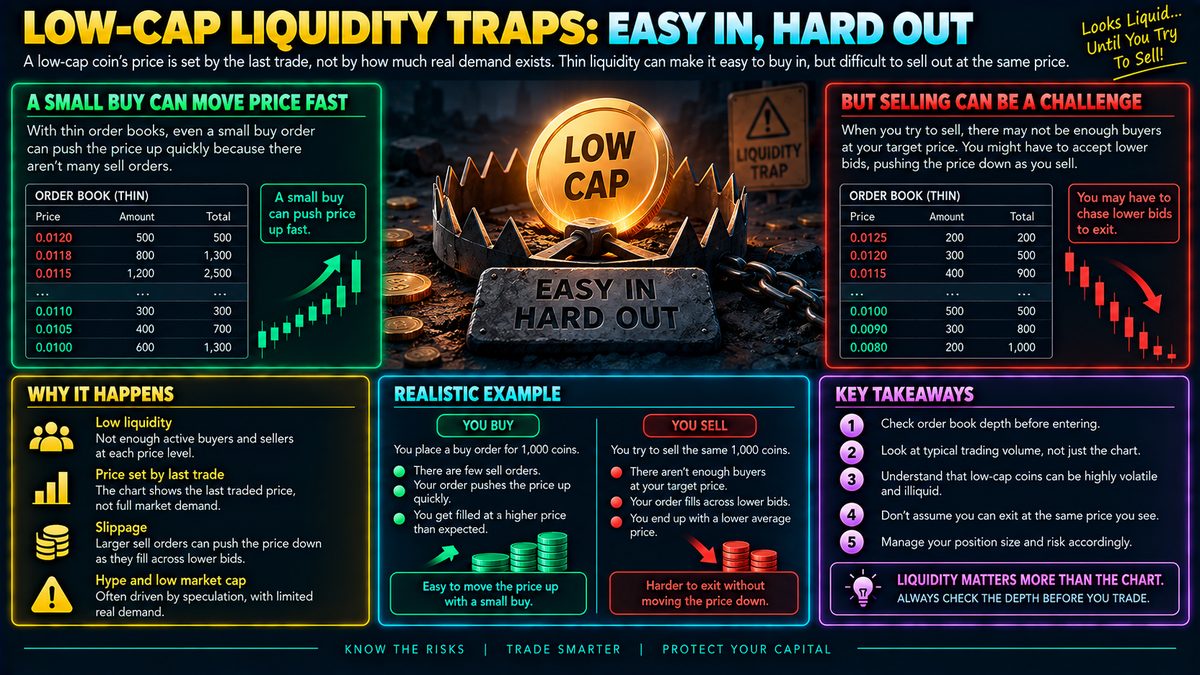
Low-Cap Crypto Liquidity Traps: Why Exiting Is Harder Than Entering
A low-cap coin's price is set by the last trade, not by how much real demand exists behind it. With thin order books, even a small buy order can push price up fast, but when you…
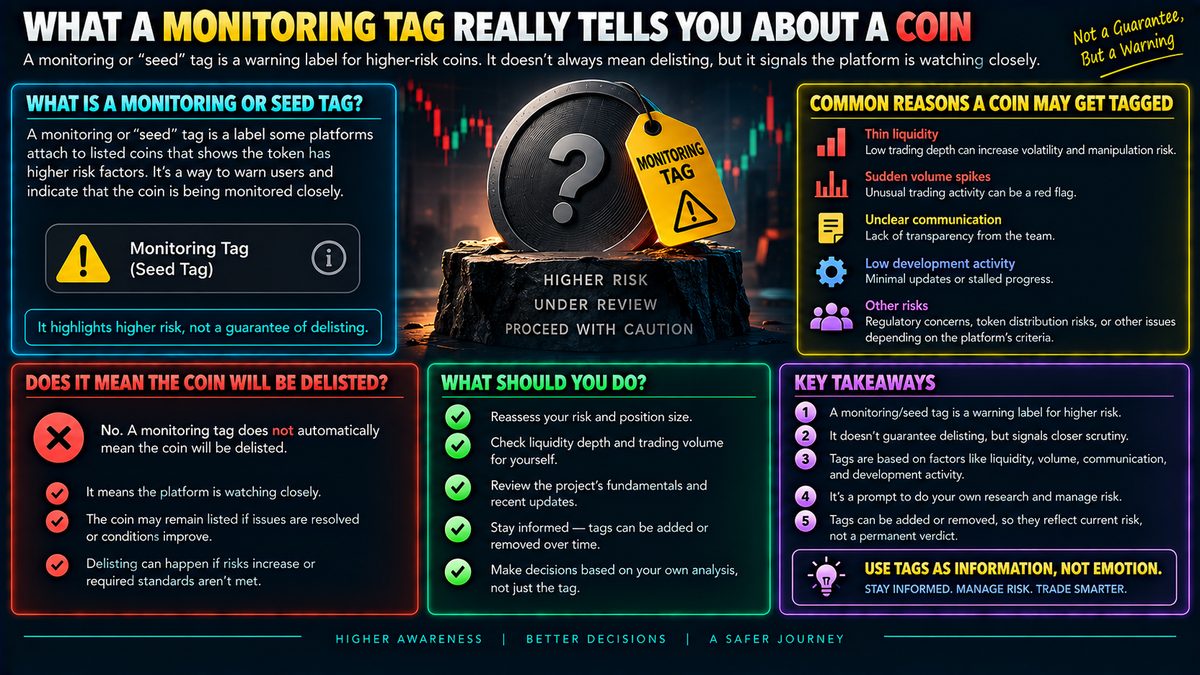
Monitoring Tag on a Coin: What It Really Means
A monitoring or "seed" tag is a warning label some platforms attach to listed coins that show red flags like thin liquidity, sudden volume spikes, unclear team communication, or…
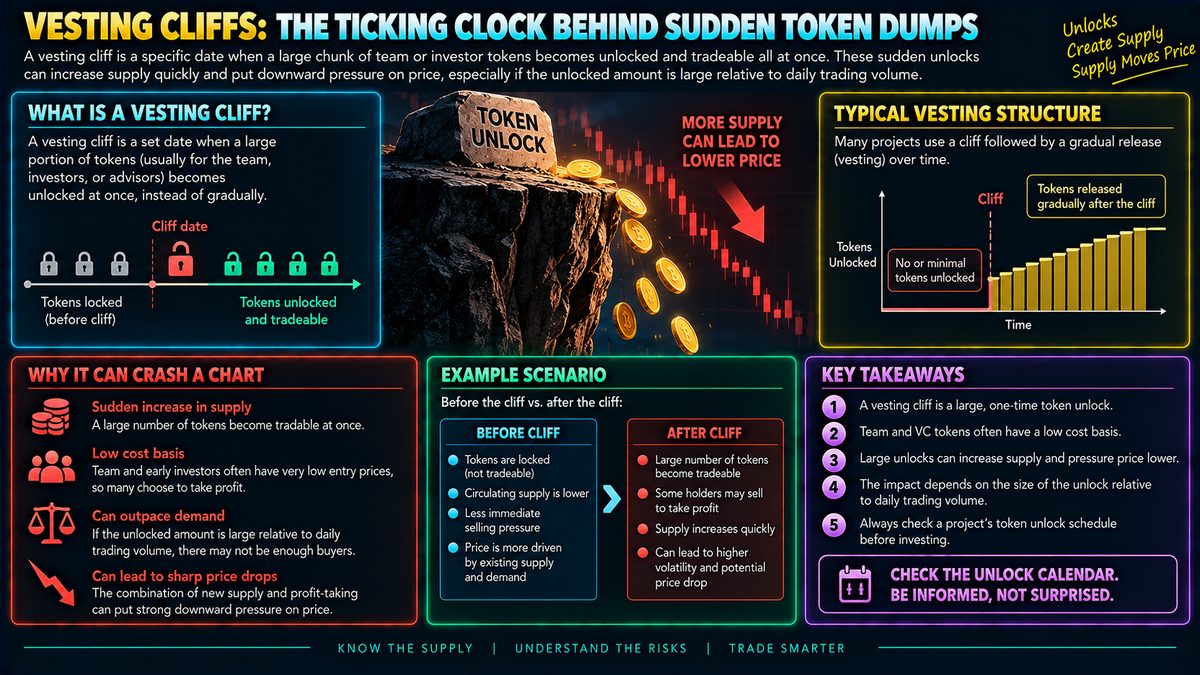
Vesting Cliff: What It Means for Sudden Token Dumps
A vesting cliff is a set date when a big chunk of team or investor tokens becomes unlocked and tradeable all at once, instead of trickling in gradually. Before the cliff, those…
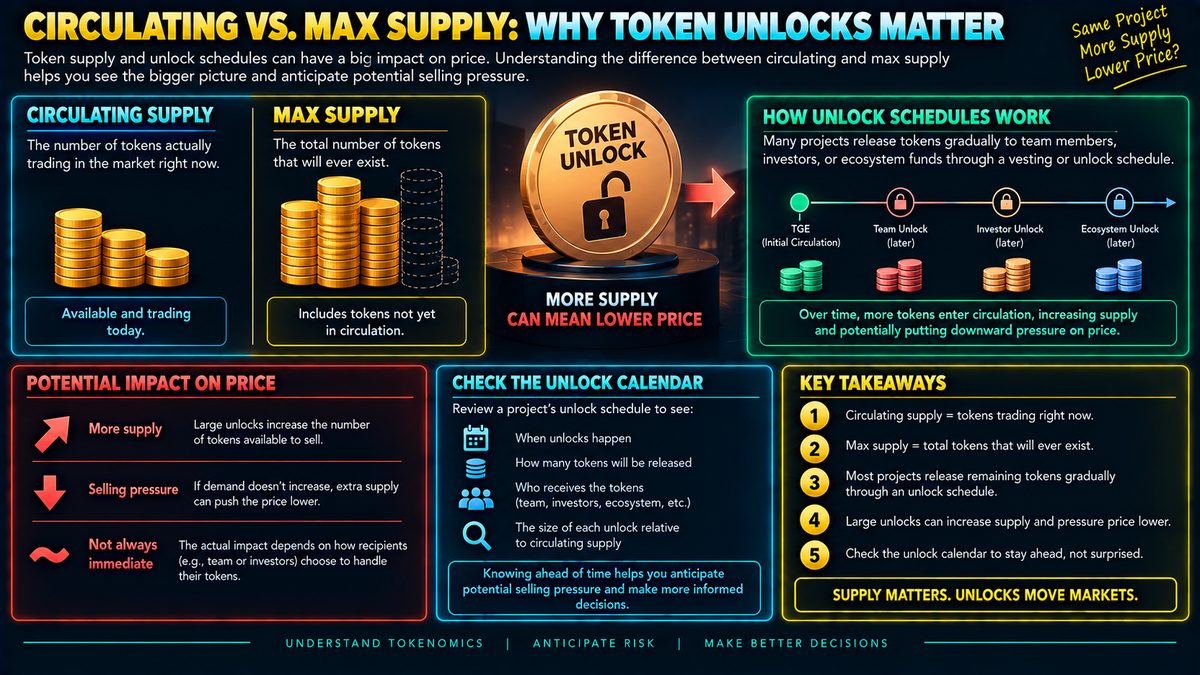
Circulating vs. Max Supply: Why Token Unlocks Matter
Circulating supply is the number of tokens actually trading right now, while max supply is the total that will ever exist. Many projects release the rest gradually to team…
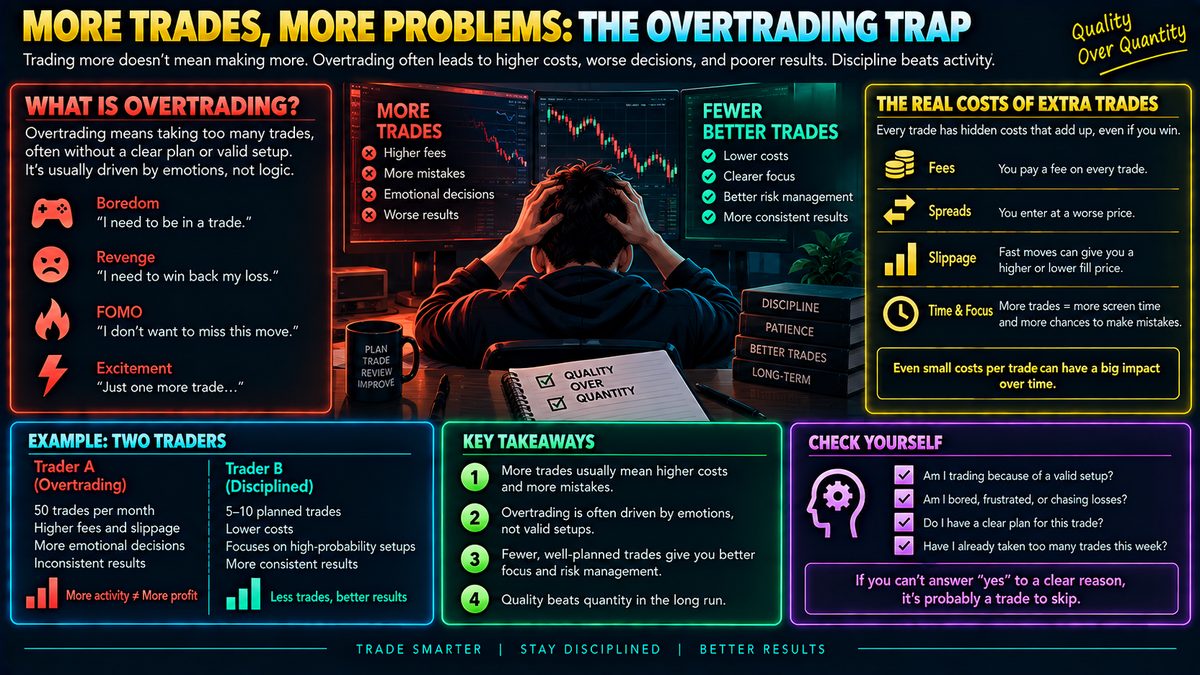
Overtrading in Crypto Trading: What It Is and Why It Hurts Returns
Overtrading happens when you take trades out of boredom, revenge, or fear of missing out rather than a real setup. Every extra trade adds fees, spreads, and slippage, which…
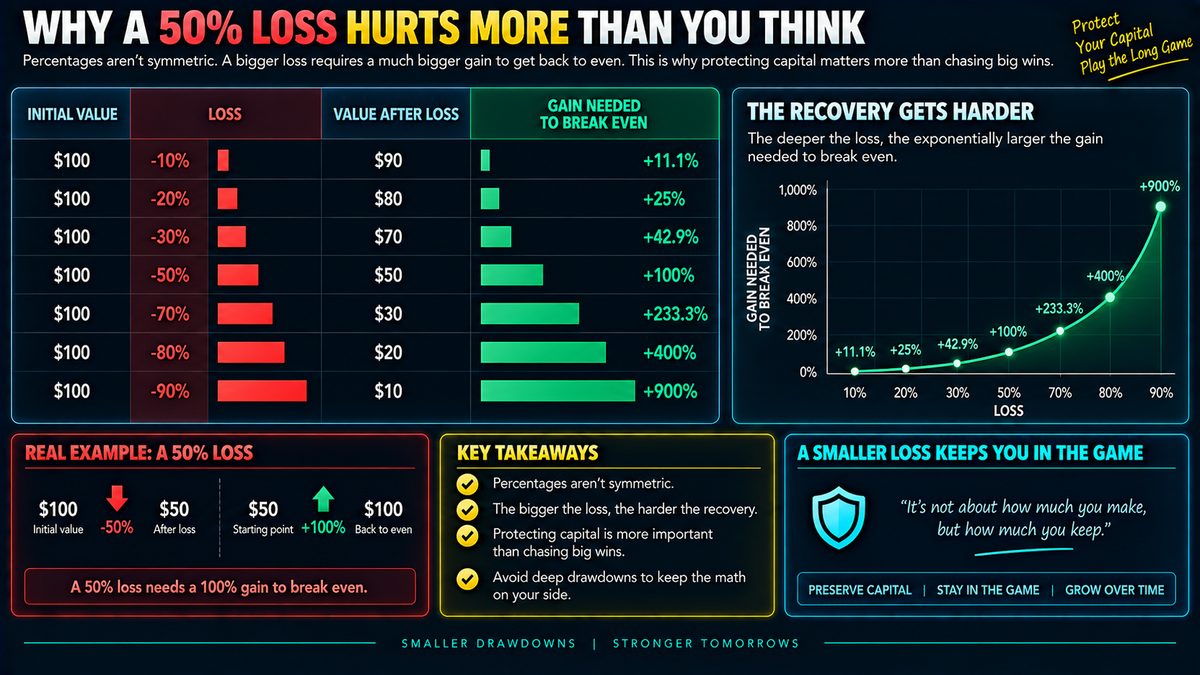
Why a 50 Percent Loss Needs a 100 Percent Gain to Recover
Percentages aren't symmetric. If your portfolio drops 50%, you don't need a 50% gain to recover — you need 100%, because you're now growing from a much smaller base. Lose 80% and…
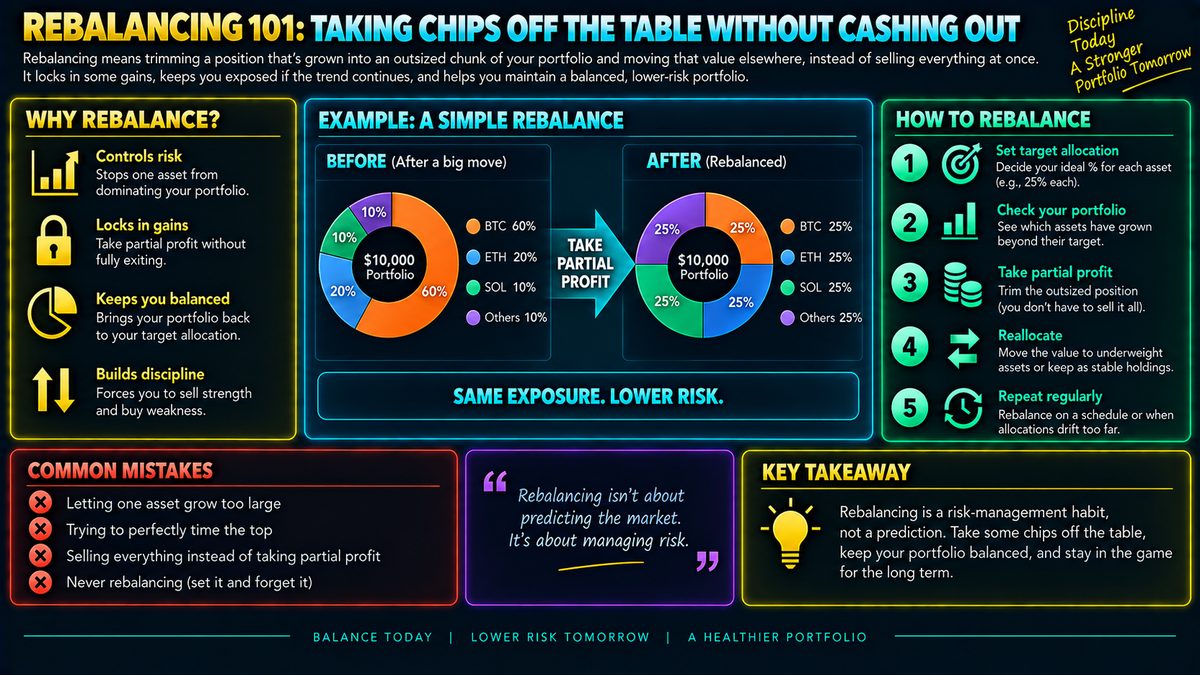
Rebalancing Crypto Portfolio: Taking Profit Without Selling All
Rebalancing means trimming a position that's grown into an outsized chunk of your portfolio and moving that value elsewhere, instead of selling everything at once. If one asset…
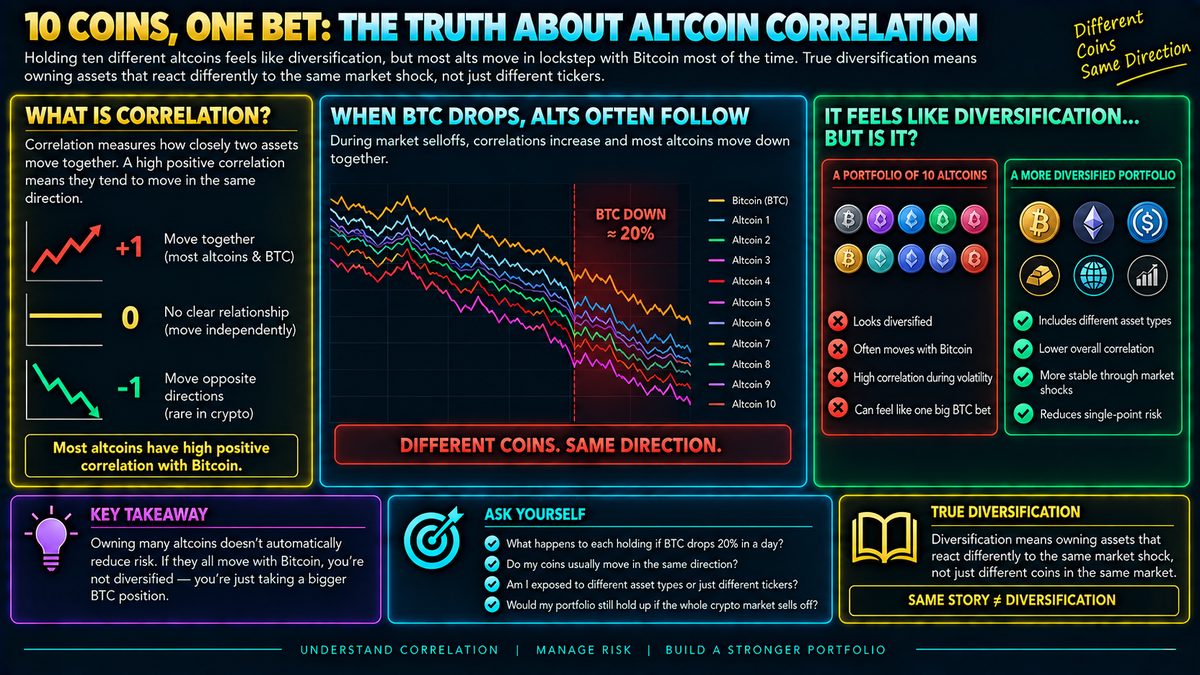
Altcoin Correlation to Bitcoin: Why Diversification Often Fails
Holding ten different altcoins feels like diversification, but most alts move in lockstep with Bitcoin most of the time — when BTC drops hard, correlations spike and everything…
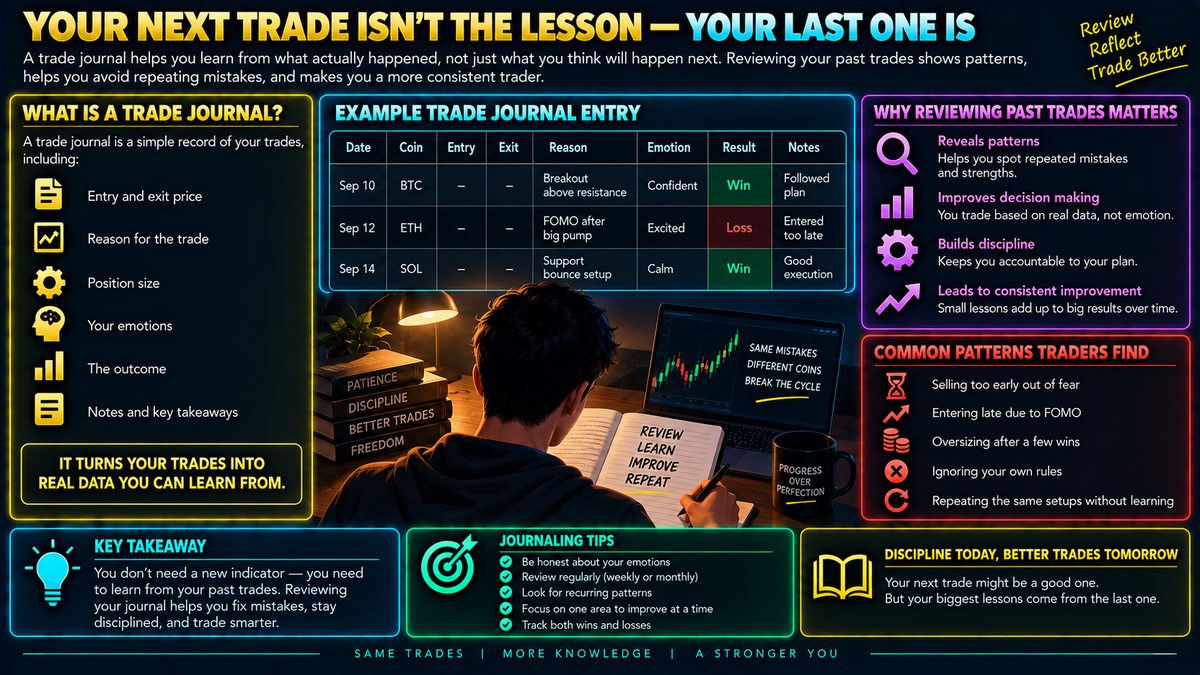
Trade Journal: How to Log and Review Your Trades to Improve
A trade journal is a simple log of what you entered, why, and what happened after — price, reasoning, emotion, outcome. Most traders chase the next setup instead of studying the…
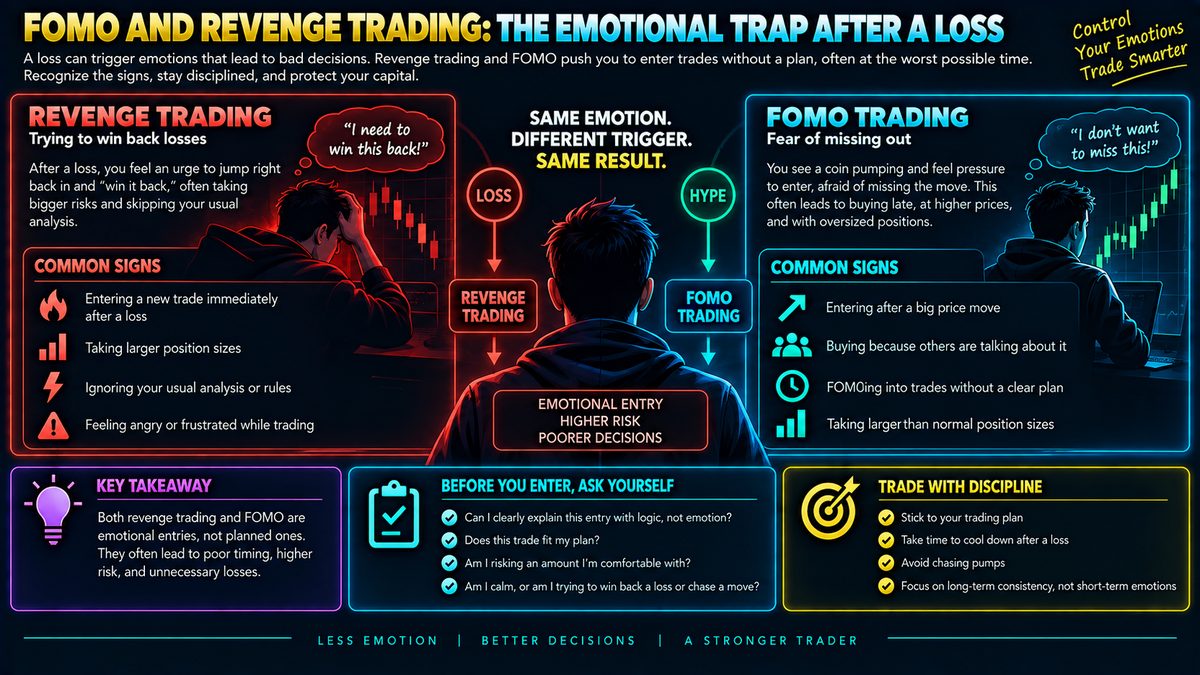
FOMO and Revenge Trading: How to Spot Emotional Crypto Entries
Revenge trading happens when a loss triggers an urge to jump right back in and "win it back," often skipping your usual analysis. FOMO is similar but driven by fear of missing a…
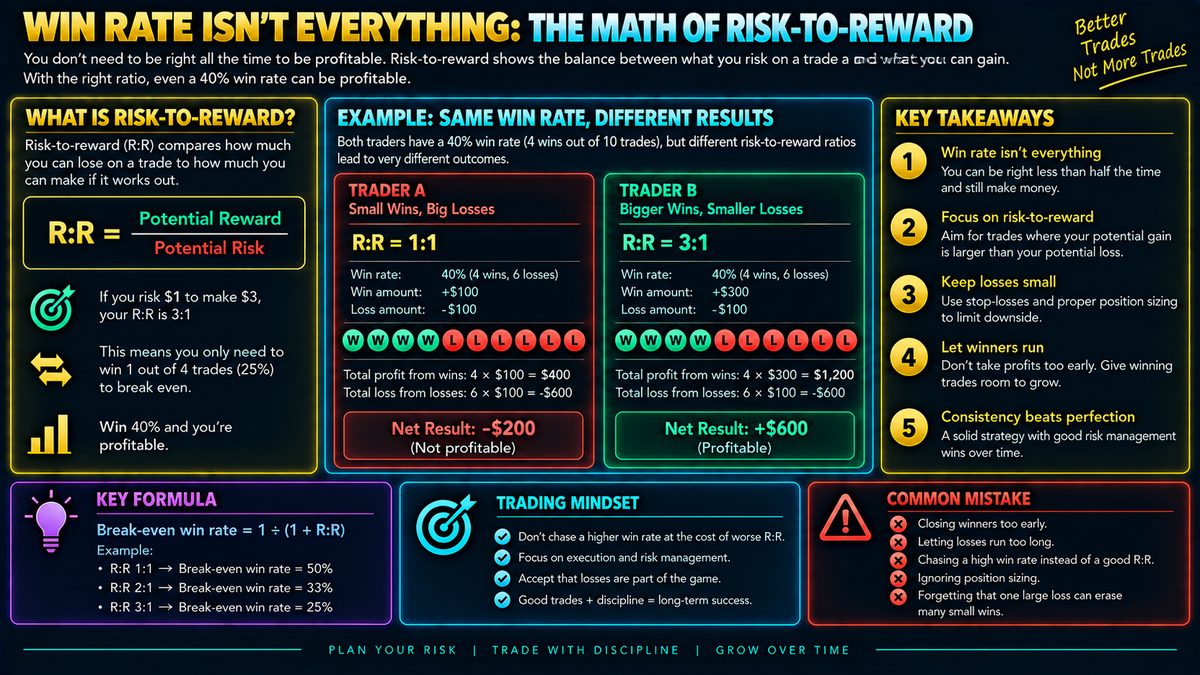
Risk-to-Reward Ratio Explained: Why Win Rate Isn't Everything
Risk-to-reward compares what you're risking on a trade to what you stand to gain if it works out. If you risk $1 to make $3, you only need to win about 1 in 4 trades to break even…
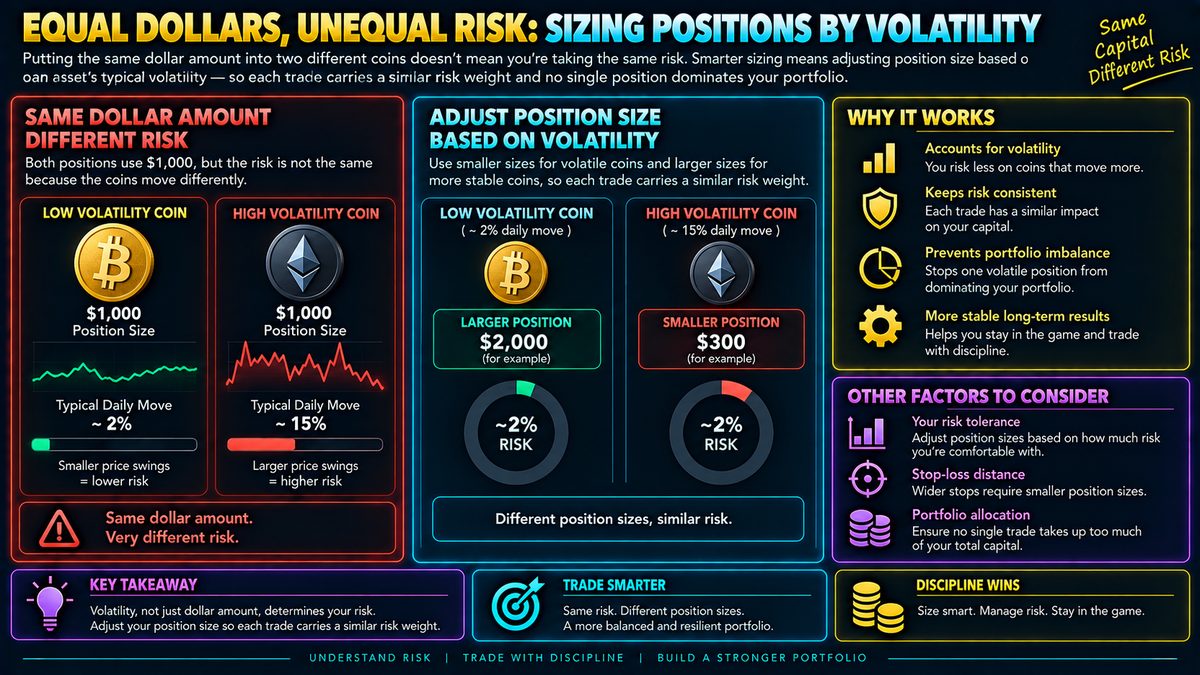
Position Sizing by Volatility: Equalizing Risk Across Coins
Putting the same dollar amount into two different coins doesn't mean you're taking the same risk. A coin that swings 15% in a day can wipe out far more of your capital than one…
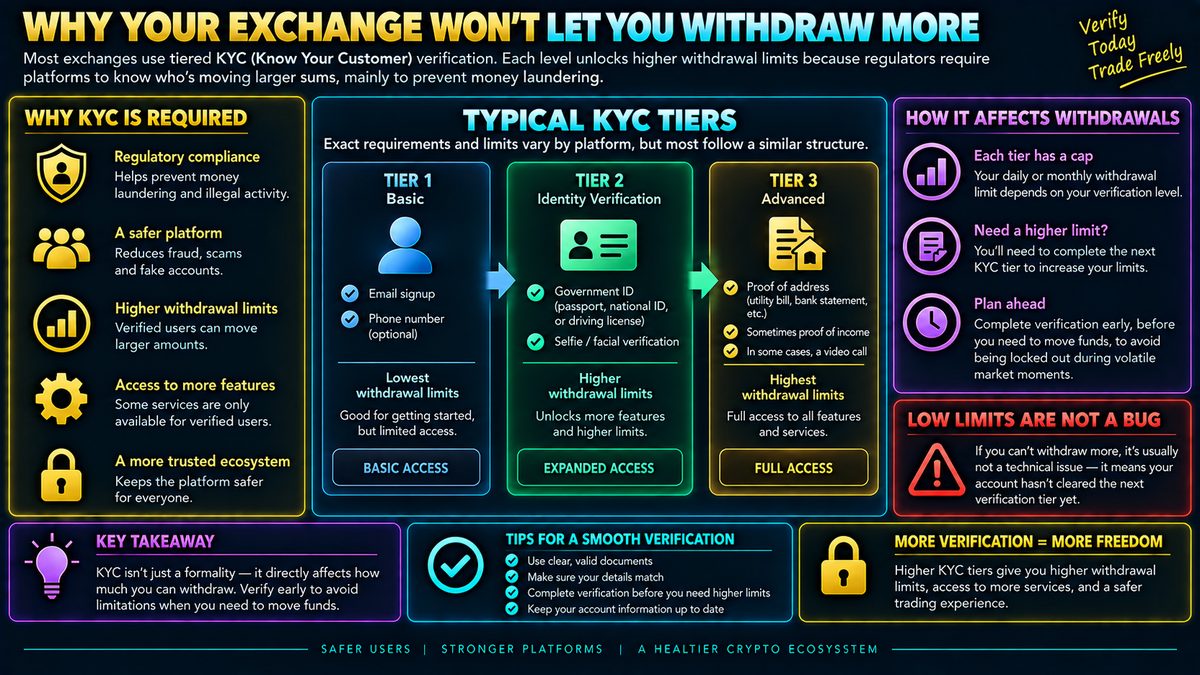
Why Crypto Exchanges Cap Your Withdrawal Amount: KYC Tiers Explained
Most exchanges use tiered KYC (Know Your Customer) verification — basic email signup, then ID checks, then proof of address or income, sometimes even a video call. Each tier…
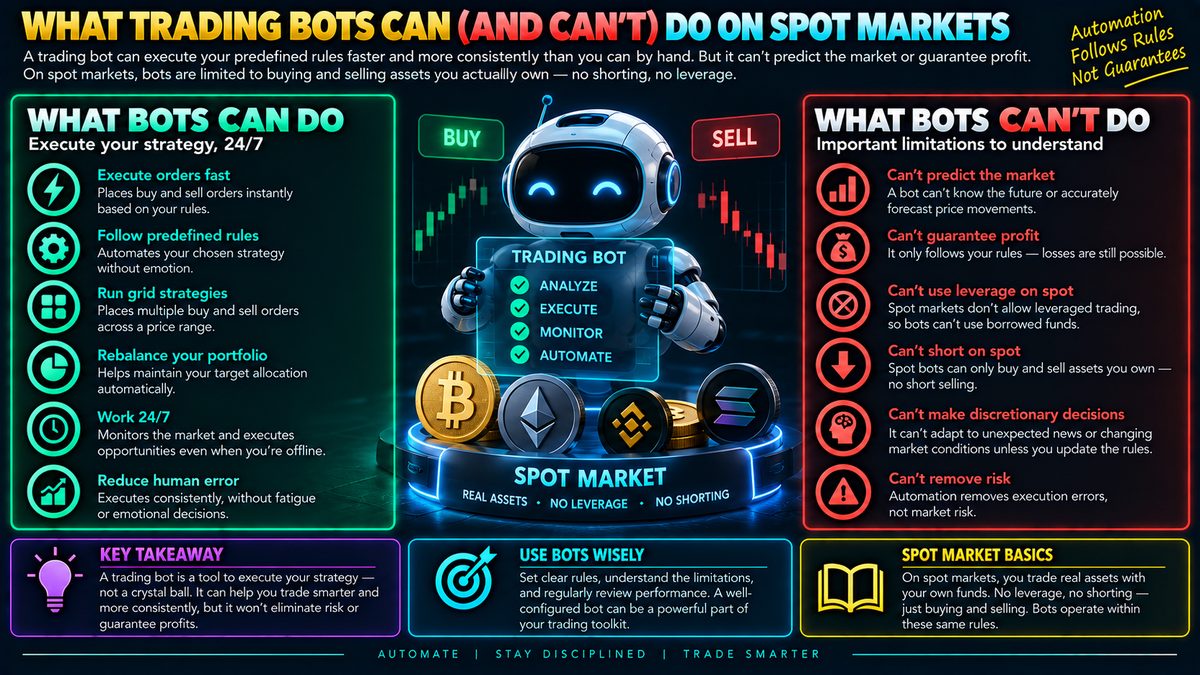
Trading Bots on Spot Markets: What They Can and Can't Do
A trading bot can execute your predefined rules faster and more consistently than you can by hand — placing orders, managing grids, or rebalancing without emotion or fatigue. What…
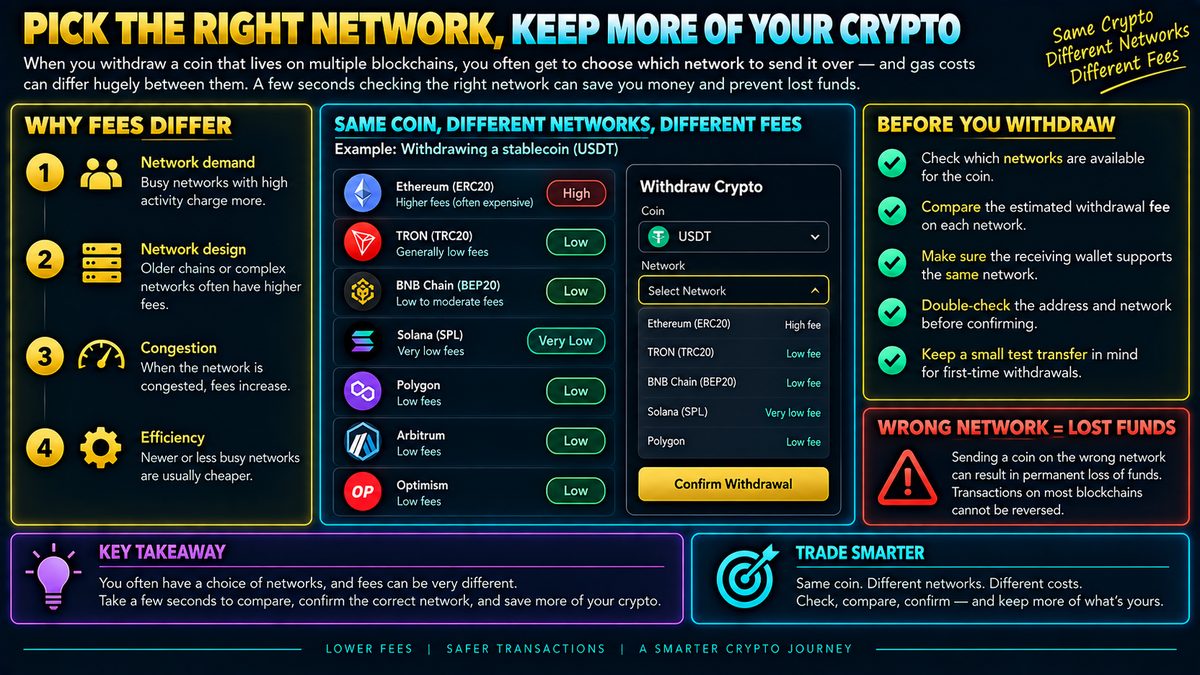
Choosing the Right Crypto Network to Save on Gas Fees
When you withdraw a coin that lives on multiple blockchains, you often get to choose which network to send it over — and gas costs can differ hugely between them. Older or more…
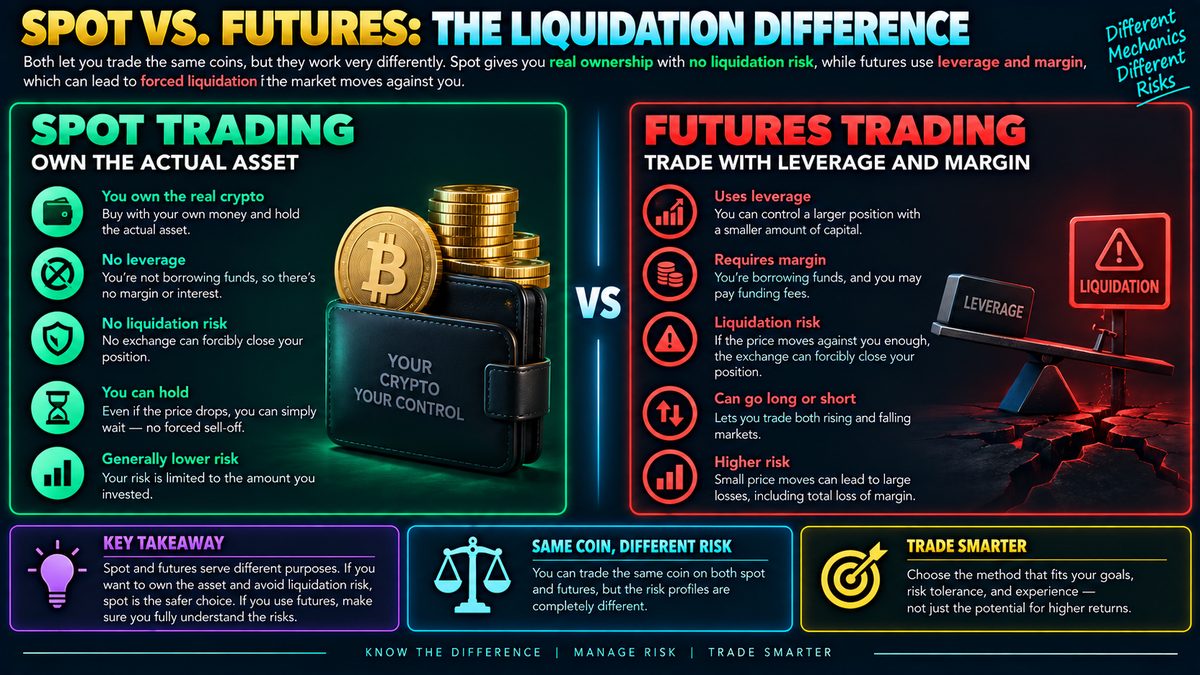
Spot vs Futures Trading: Why Only Futures Can Get Liquidated
When you buy crypto on spot, you own the actual asset outright with your own money — there's no borrowed leverage and no exchange that can forcibly close your position. Futures…
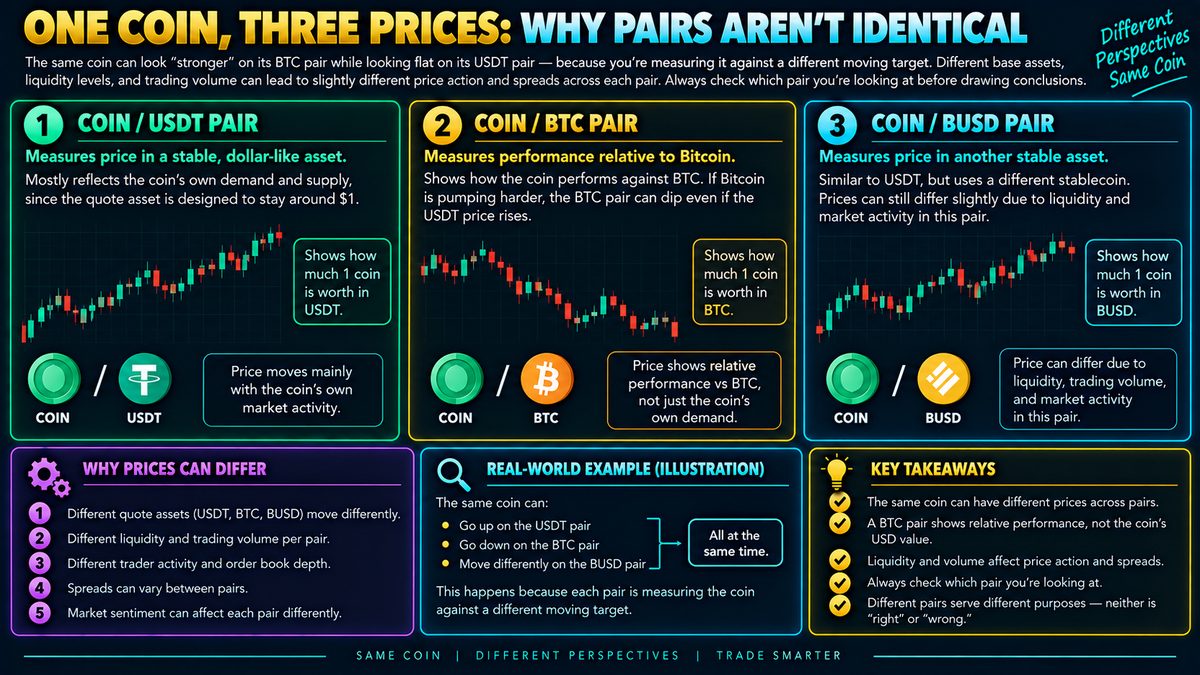
Why Crypto Pairs Show Different Prices for the Same Coin
The same coin can look "stronger" on its BTC pair while looking flat on its USDT pair — because you're measuring it against a different moving target. A USDT pair shows price…
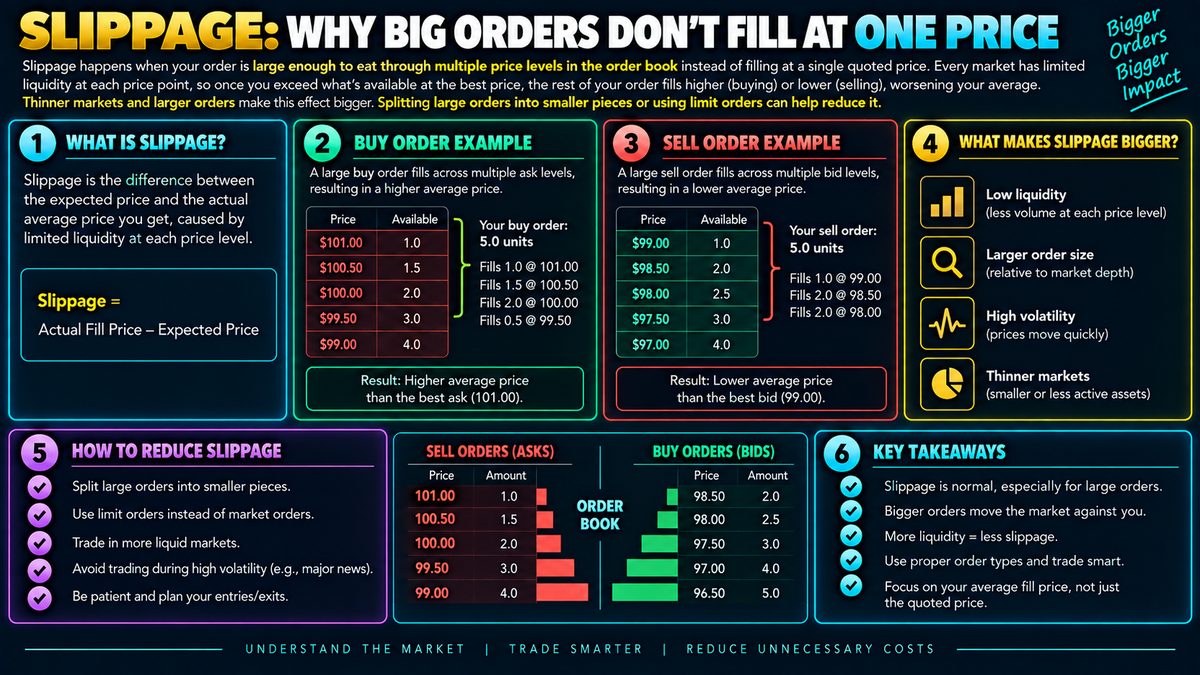
Slippage in Crypto Trading: Why Big Orders Move the Price
Slippage happens when your order is large enough to eat through multiple price levels in the order book instead of filling at a single quoted price. Every market has limited…
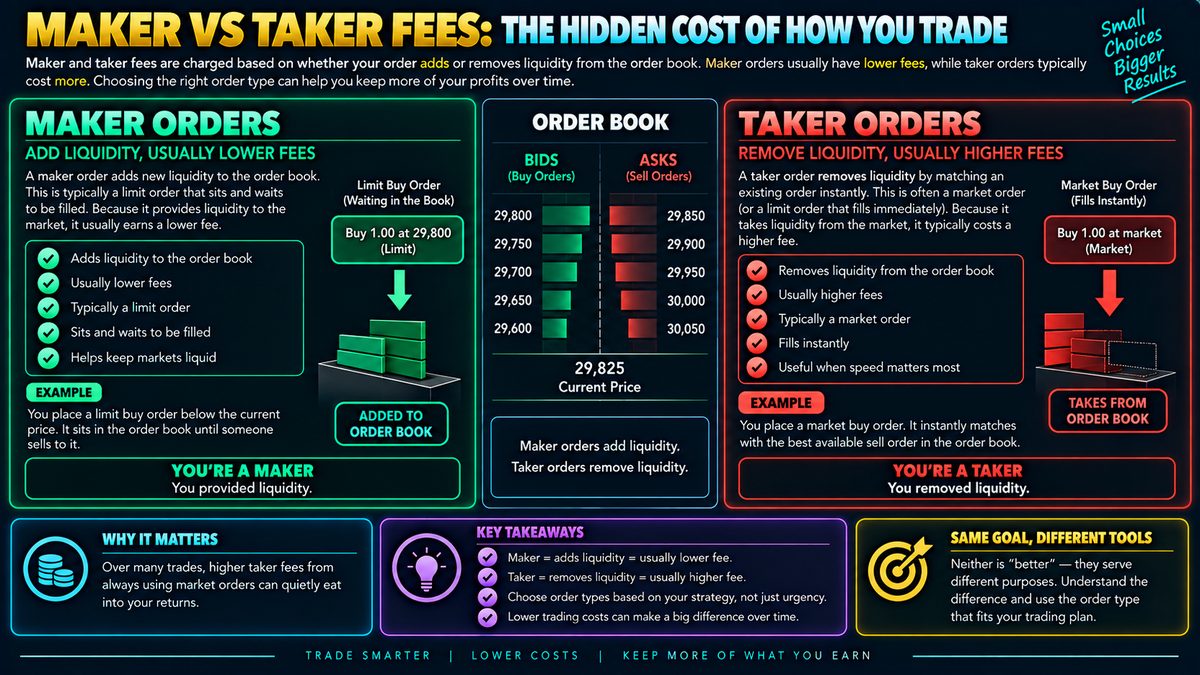
Maker vs Taker Fees: What They Mean and Why They Differ
A maker order adds new liquidity to the order book — like placing a limit order that sits and waits to be filled — and usually earns a lower fee. A taker order removes liquidity…
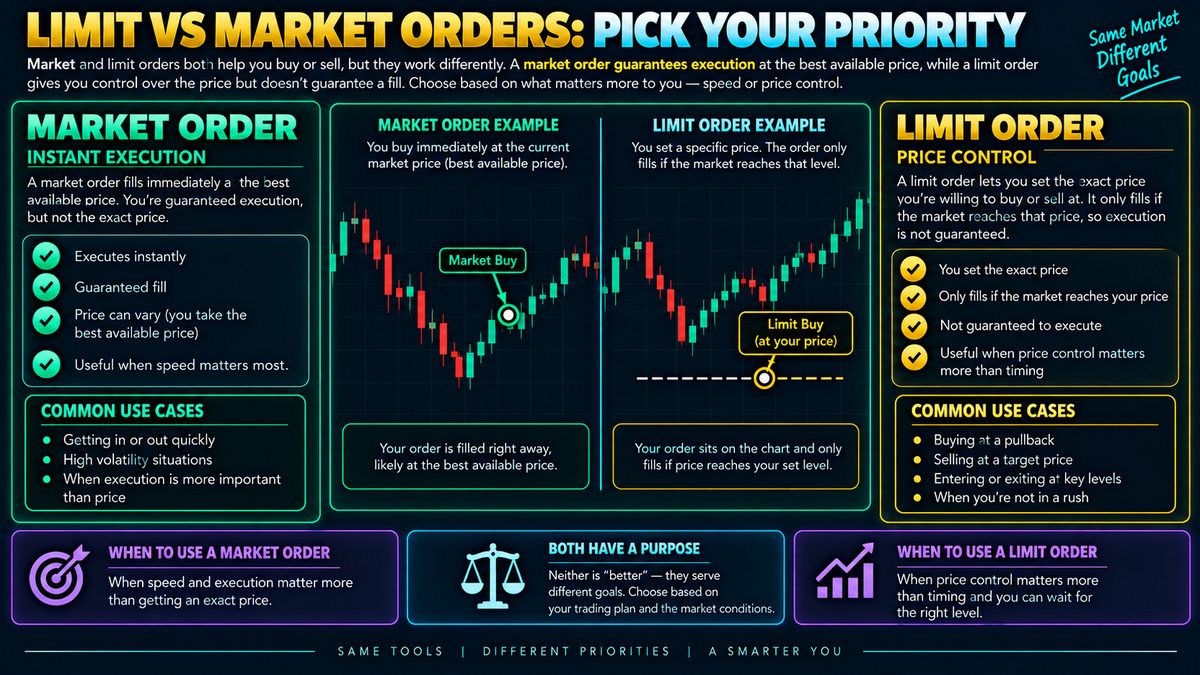
Limit vs Market Orders: Speed or Price Control
A market order fills instantly at whatever price is available — you're guaranteed execution but not the price. A limit order lets you set the exact price you're willing to buy or…
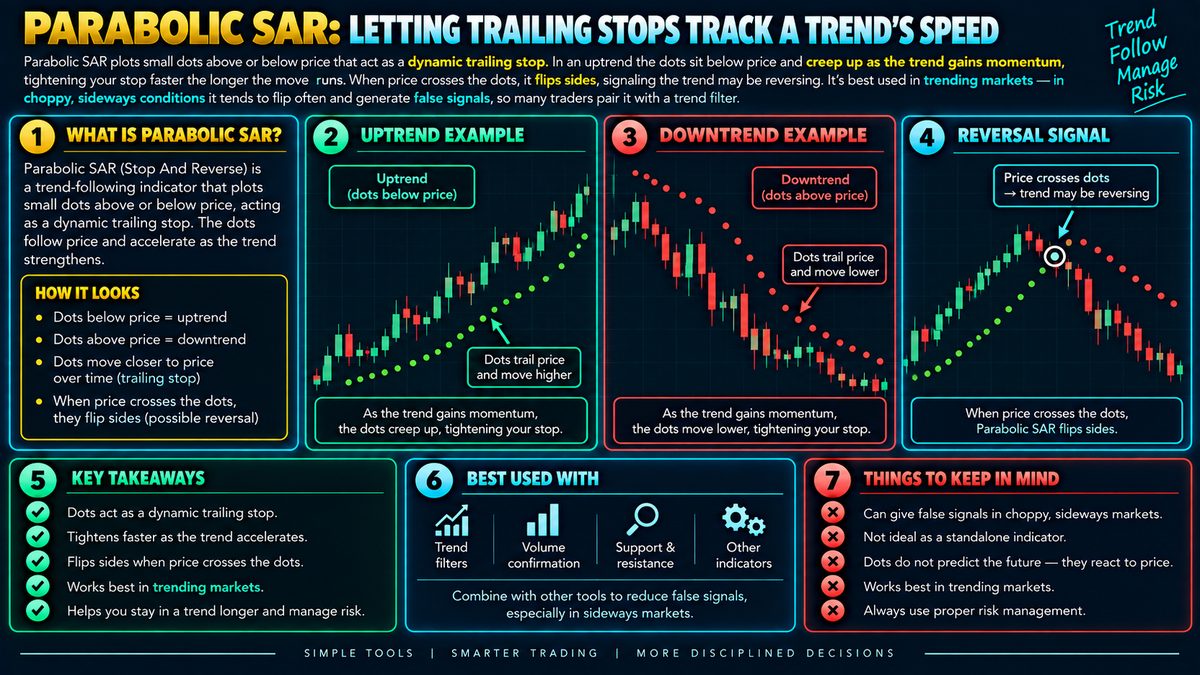
Parabolic SAR Indicator: How It Works and How to Use It
Parabolic SAR plots small dots above or below price that act as a dynamic trailing stop. In an uptrend the dots sit below price and creep up as the trend gains momentum,…
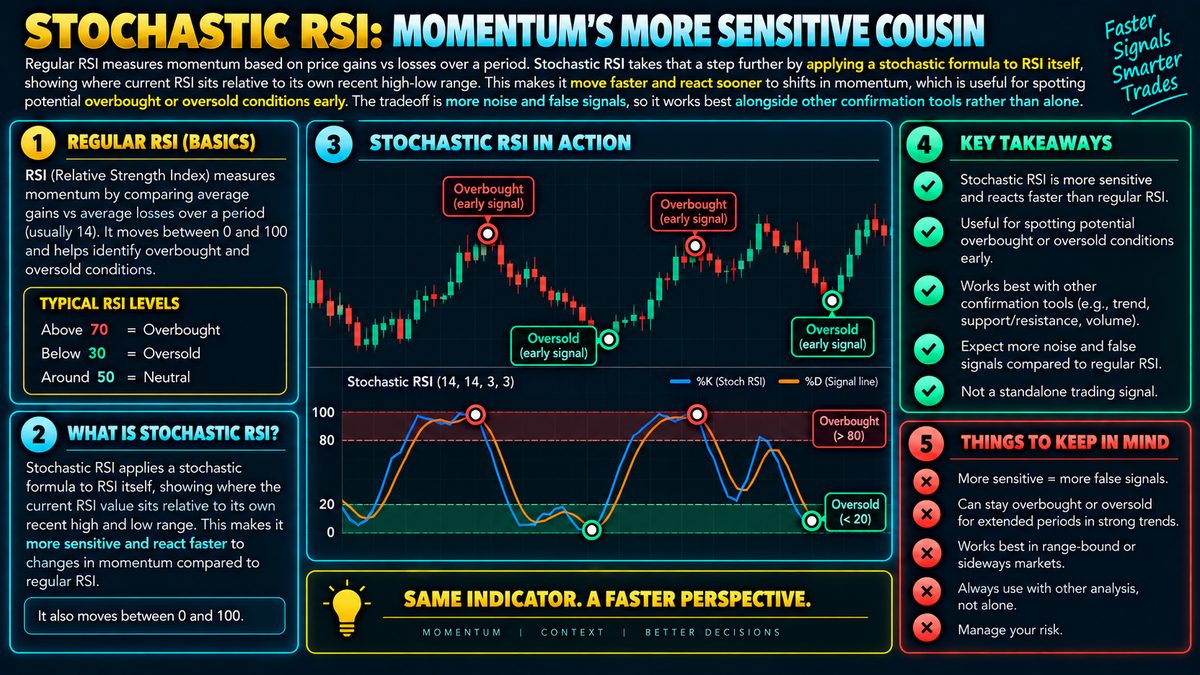
Stochastic RSI Explained: How It Differs From Regular RSI
Regular RSI measures momentum based on price gains vs losses over a period. Stochastic RSI takes that a step further by applying a stochastic formula to RSI itself, showing where…
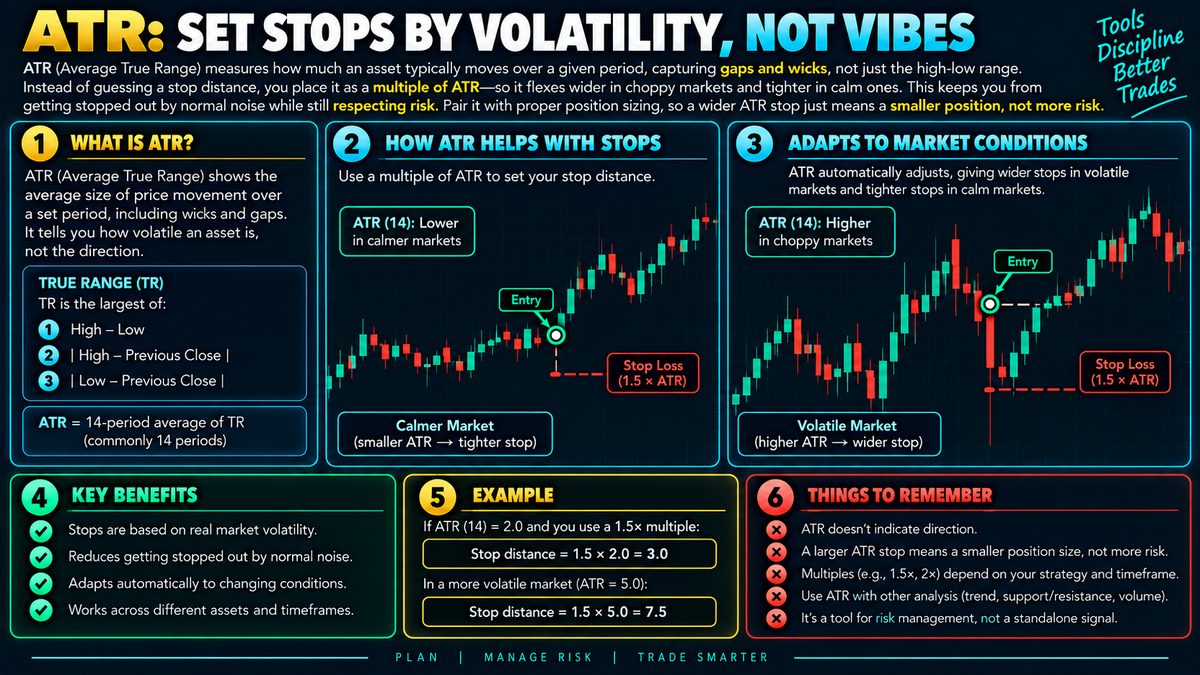
ATR: Set Stops by Volatility, Not Vibes
ATR measures how much an asset typically moves over a given period, capturing gaps and wicks, not just the high-low range. Instead of guessing a stop distance, you place it as a…
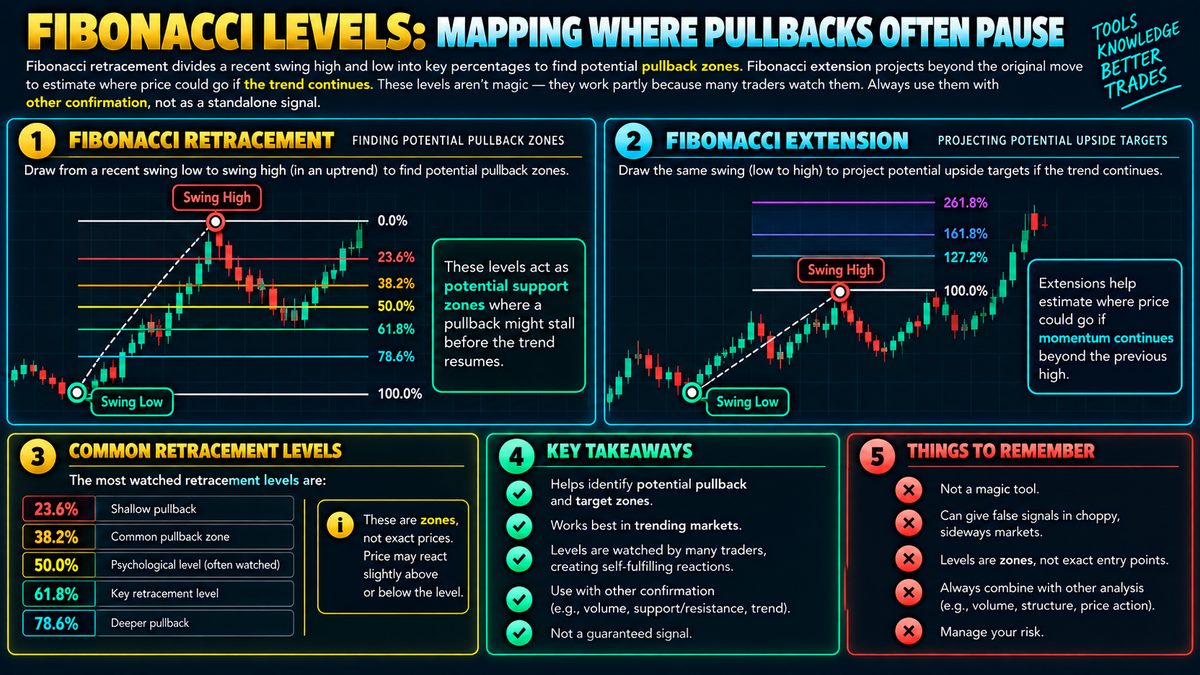
Fibonacci Retracement and Extension Levels Explained
Fibonacci retracement takes a recent swing high and low and divides that range into key percentages (like 38%, 50%, 61.8%) to flag zones where a pullback might stall before the…
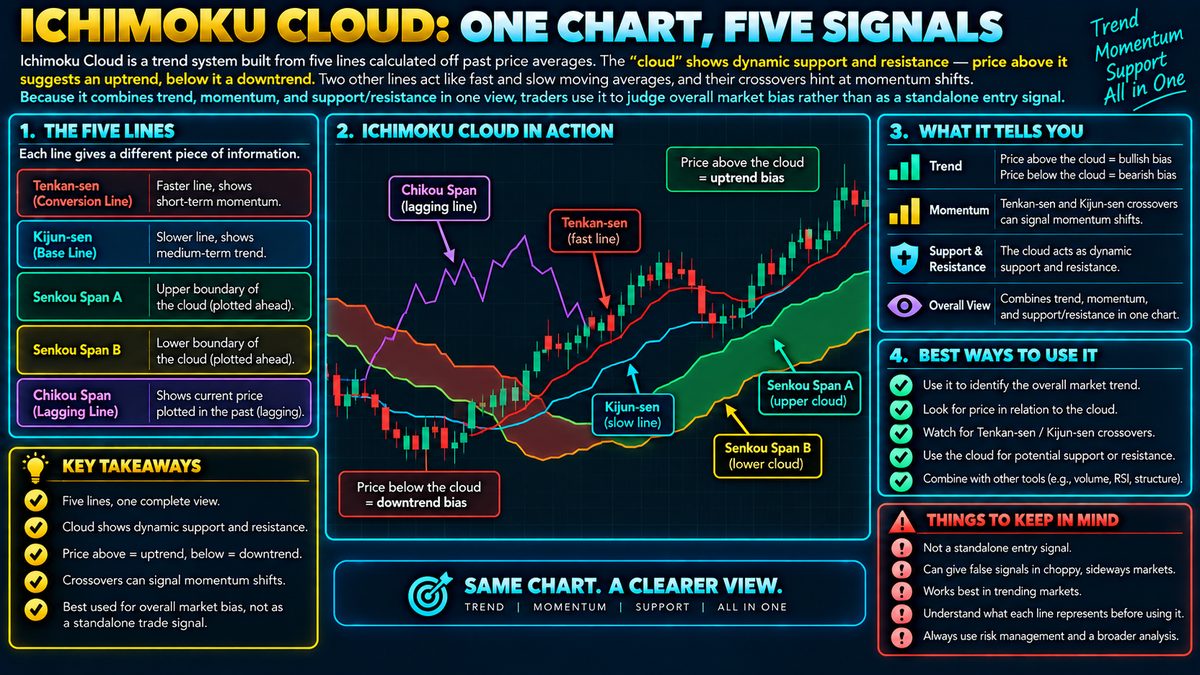
Ichimoku Cloud: What the Five Lines Mean and How to Read Them
Ichimoku Cloud is a trend system built from five lines calculated off past price averages. The "cloud" (a shaded area between two of those lines) shows dynamic support and…
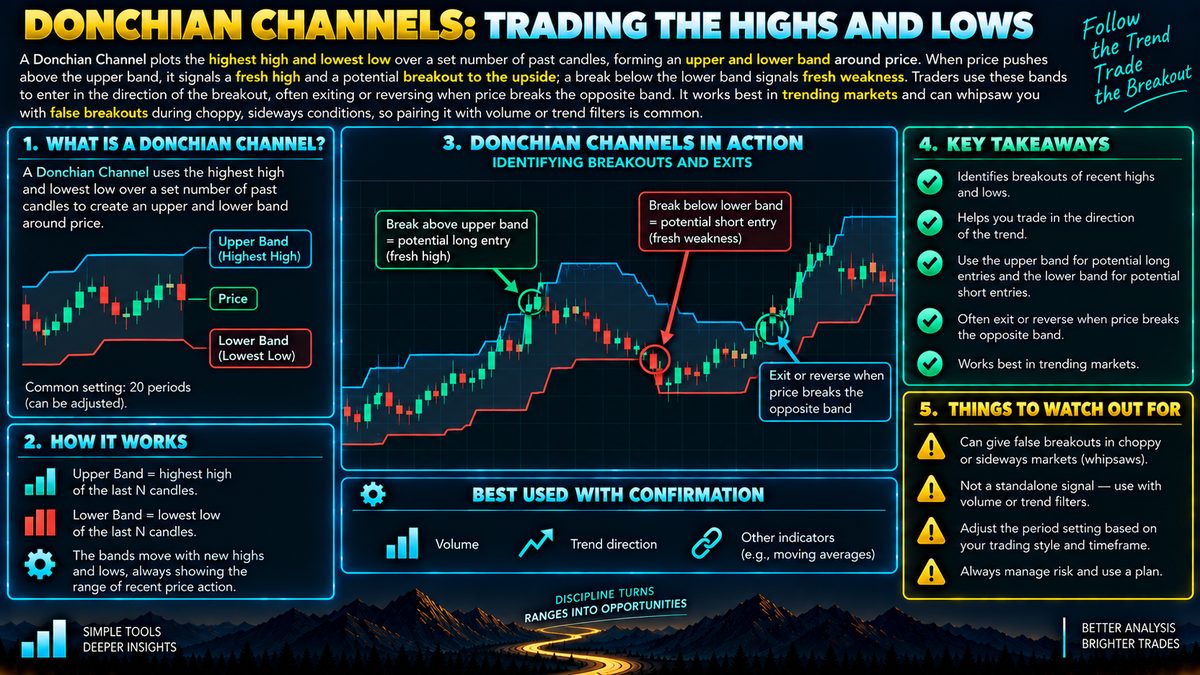
Donchian Channels: How Traders Use Them to Spot Breakouts
A Donchian Channel plots the highest high and lowest low over a set number of past candles, forming an upper and lower band around price. When price pushes above the upper band,…
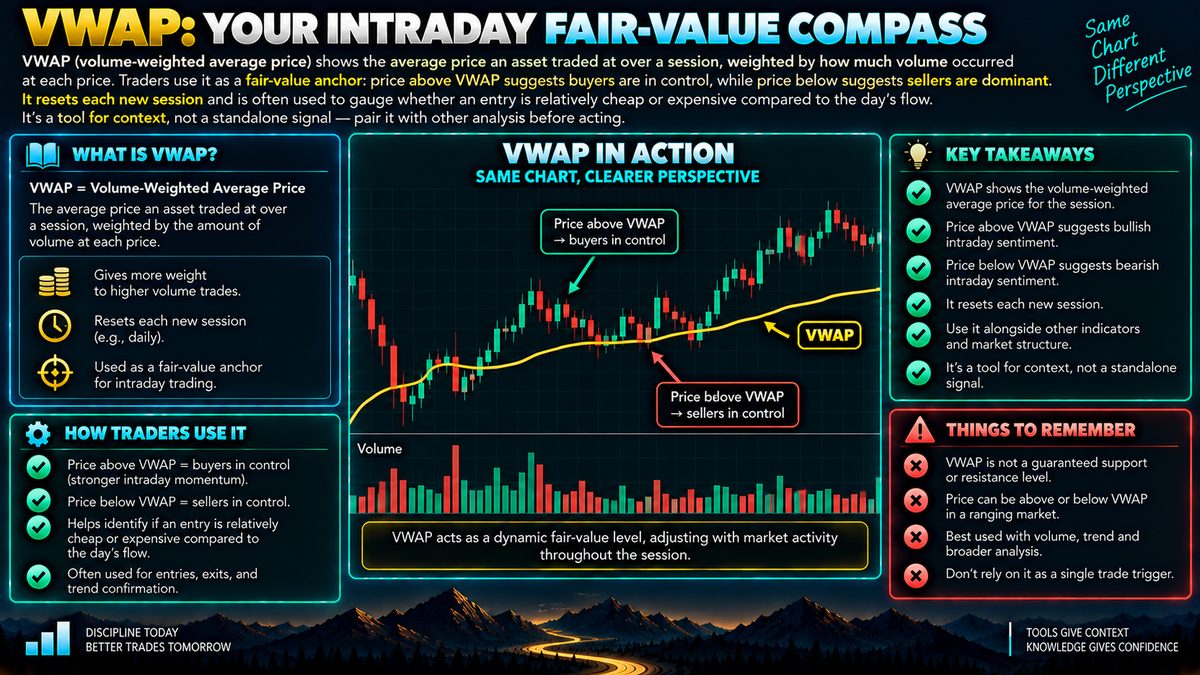
VWAP Indicator: How It Works and What It Measures
VWAP (volume-weighted average price) shows the average price an asset traded at over a session, weighted by how much volume occurred at each price. Traders use it as a fair-value…
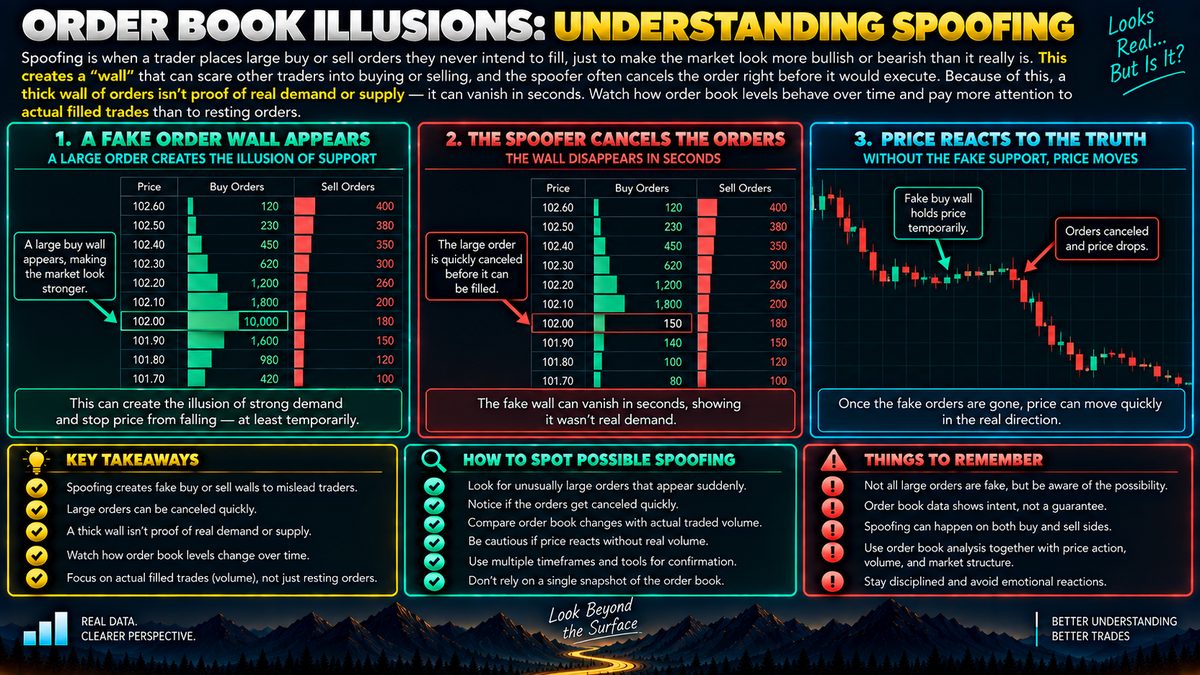
Spoofing in Crypto Trading: How Fake Order Walls Mislead Traders
Spoofing is when a trader places large buy or sell orders they never intend to fill, just to make the market look more bullish or bearish than it really is. This creates a "wall"…
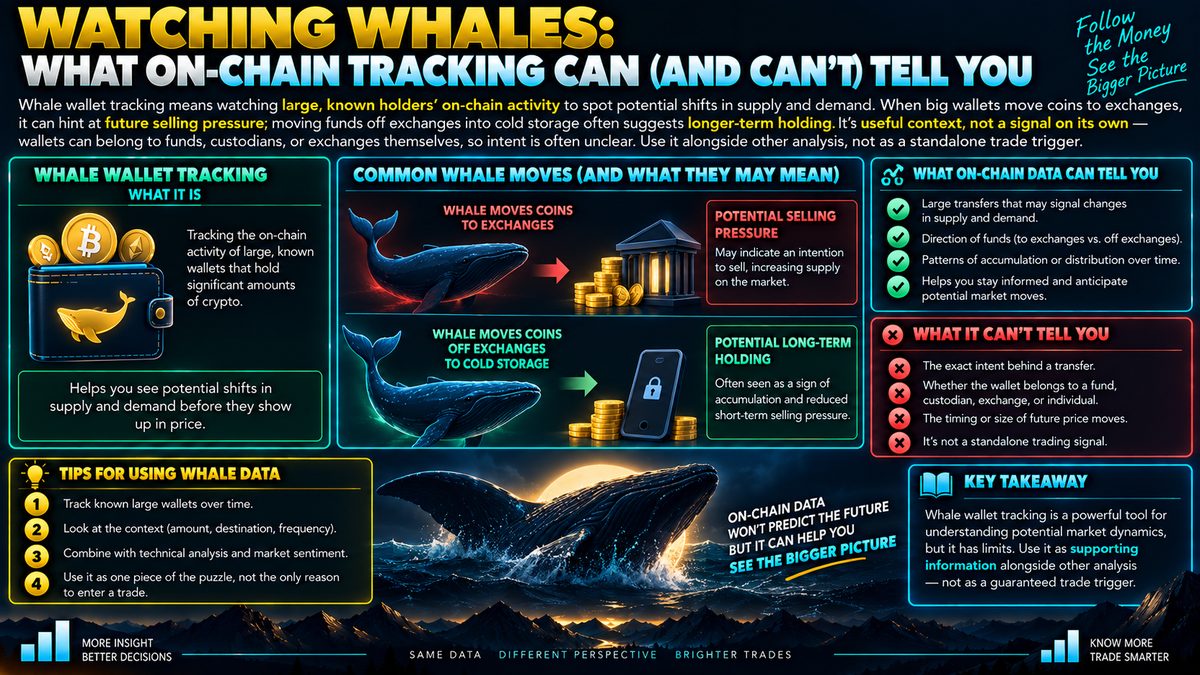
Whale Wallet Tracking: What On-Chain Data Can and Can't Tell You
Whale wallet tracking means watching large, known holders' on-chain activity to spot potential shifts in supply and demand. When big wallets move coins to exchanges, it can hint…
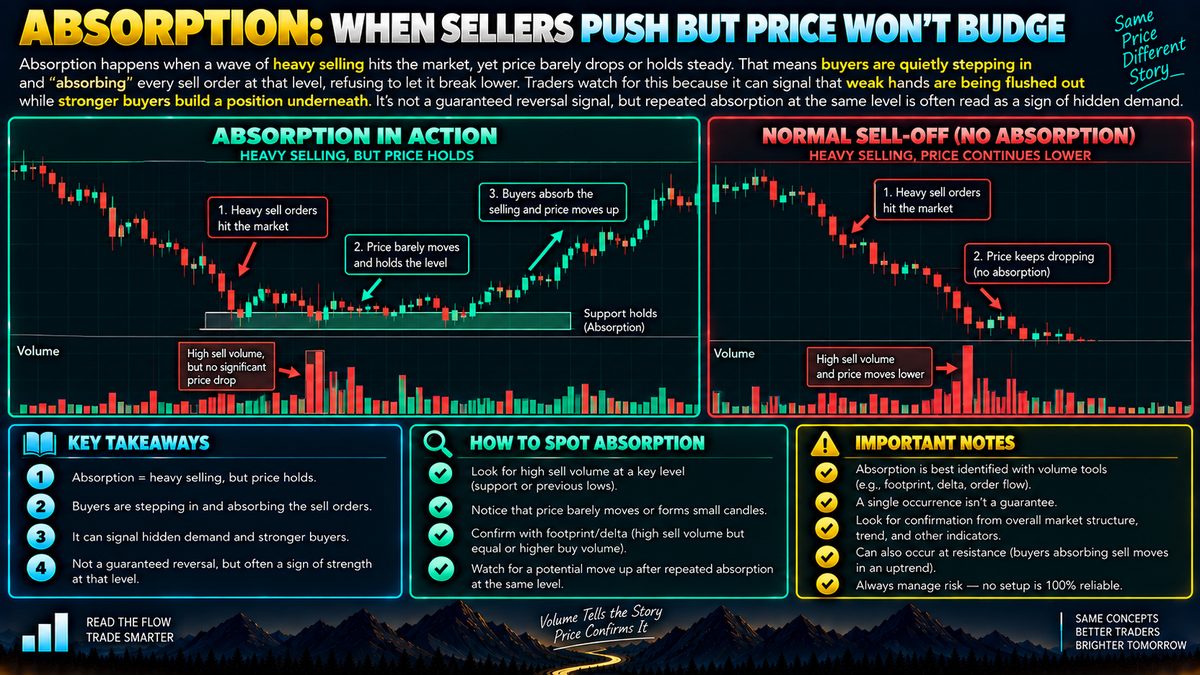
Absorption in Trading: What It Means When Price Won't Drop
Absorption happens when a wave of heavy selling hits the market, yet price barely drops or holds steady. That means buyers are quietly stepping in and "absorbing" every sell order…
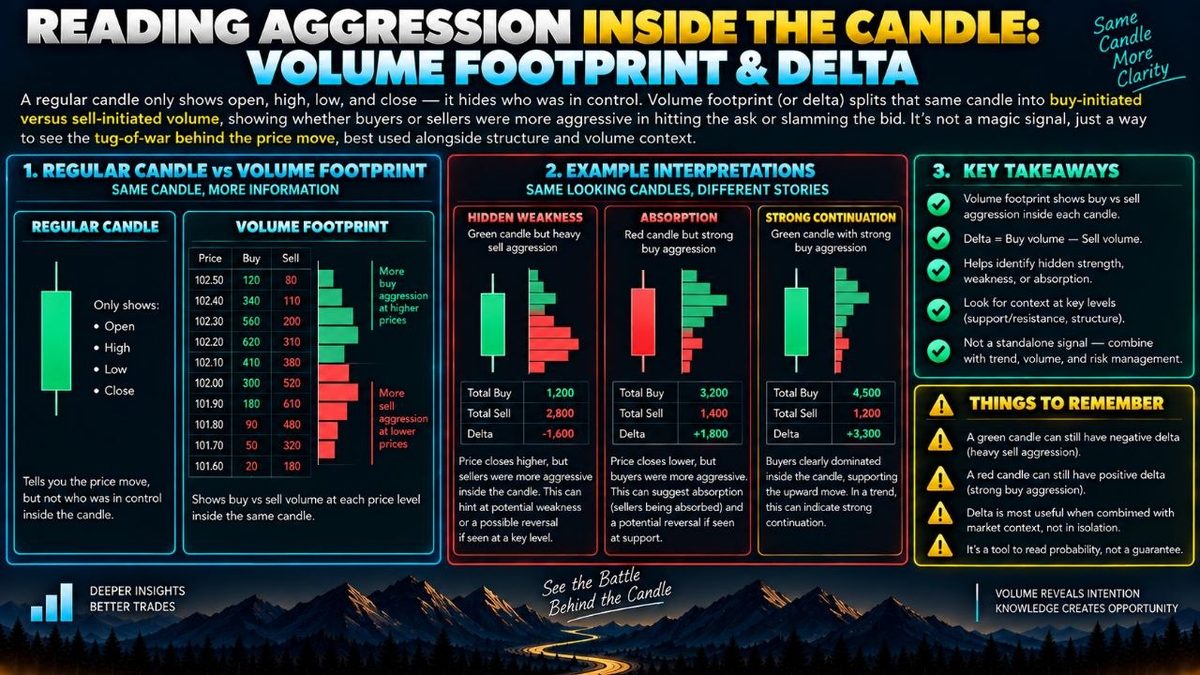
Volume Footprint and Delta: Reading Aggression Inside a Candle
A regular candle only shows open, high, low, and close — it hides who was in control. Volume footprint (or delta) splits that same candle into buy-initiated versus sell-initiated…
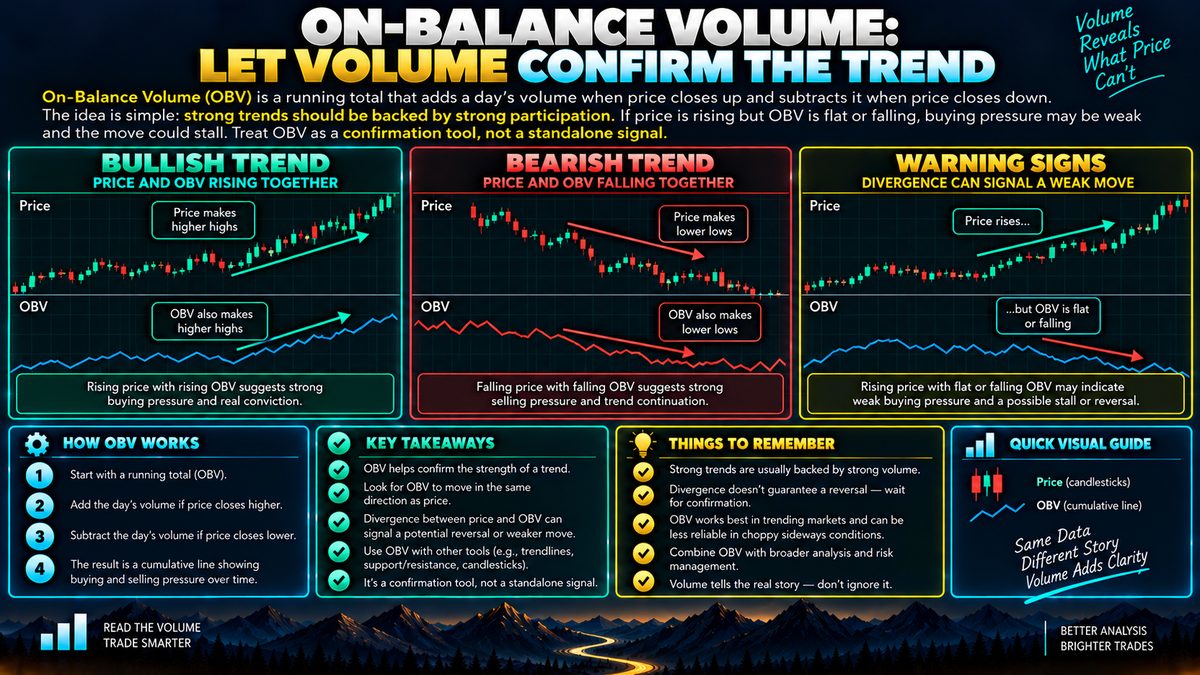
On-Balance Volume: How OBV Confirms Price Trends
On-Balance Volume (OBV) is a running total that adds a day's volume when price closes up and subtracts it when price closes down. The idea is simple: strong trends should be…
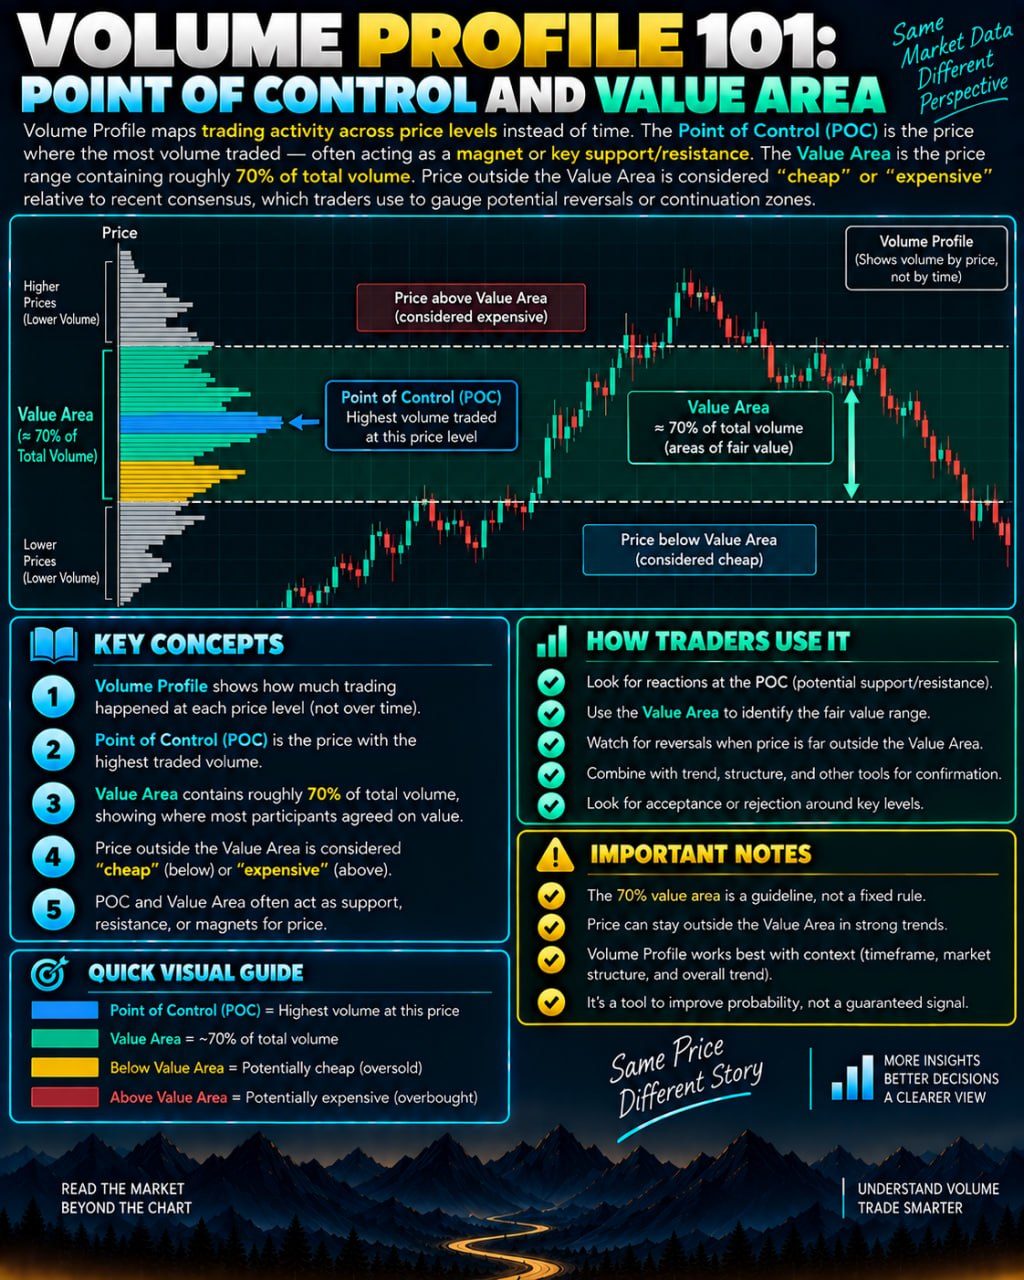
Volume Profile: What Point of Control and Value Area Mean
Volume Profile maps trading activity across price levels instead of time. The Point of Control (POC) is the price where the most volume traded — often acting as a magnet or key…
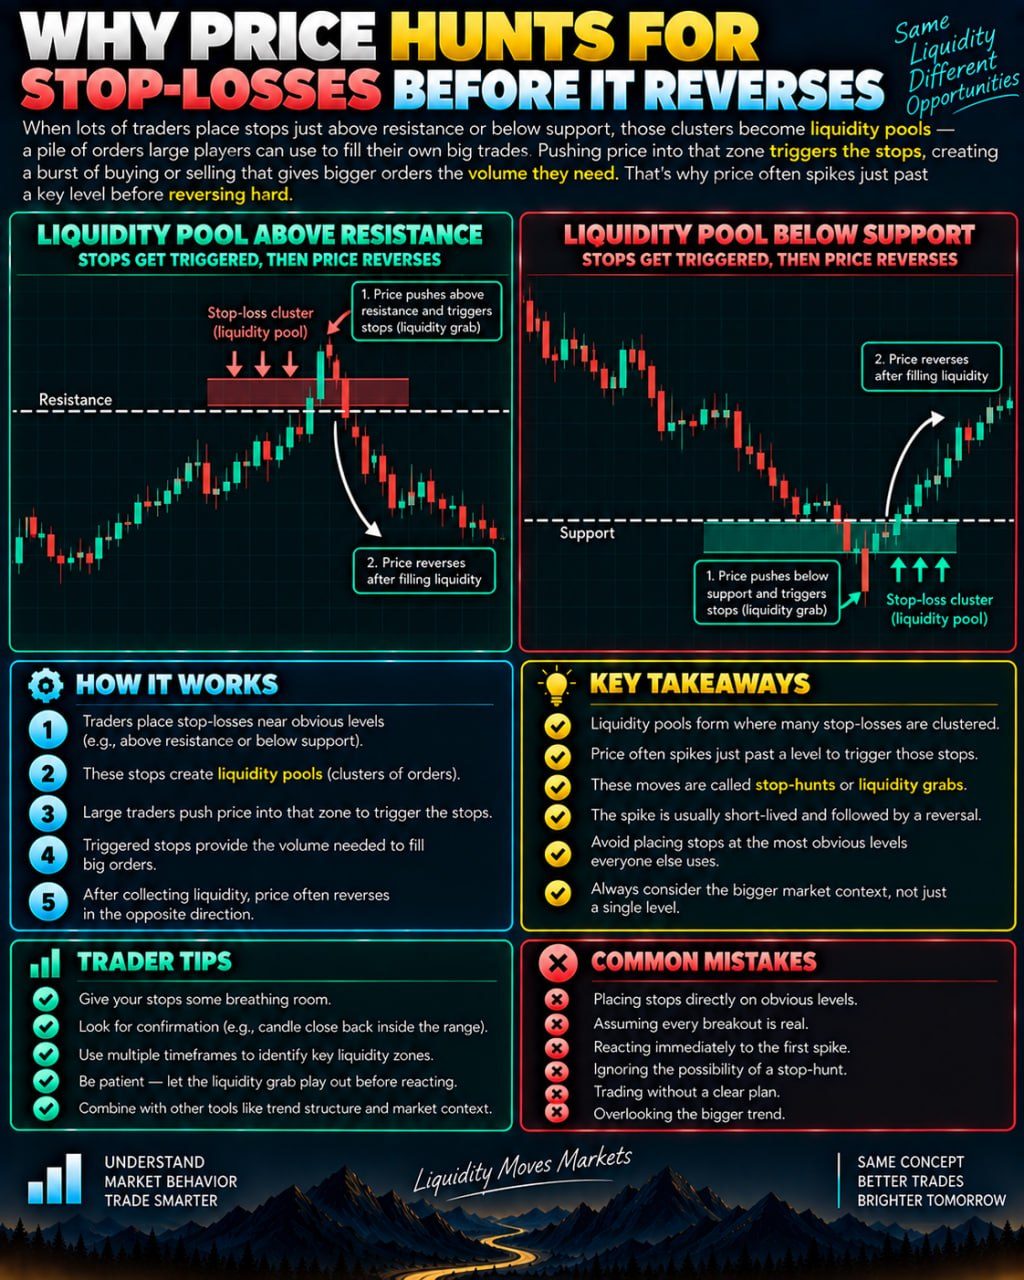
Stop Hunts and Liquidity Pools: Why Price Spikes Past Key Levels
When lots of traders place stops just above resistance or below support, those clusters become "liquidity pools" — a pile of orders large players can use to fill their own big…
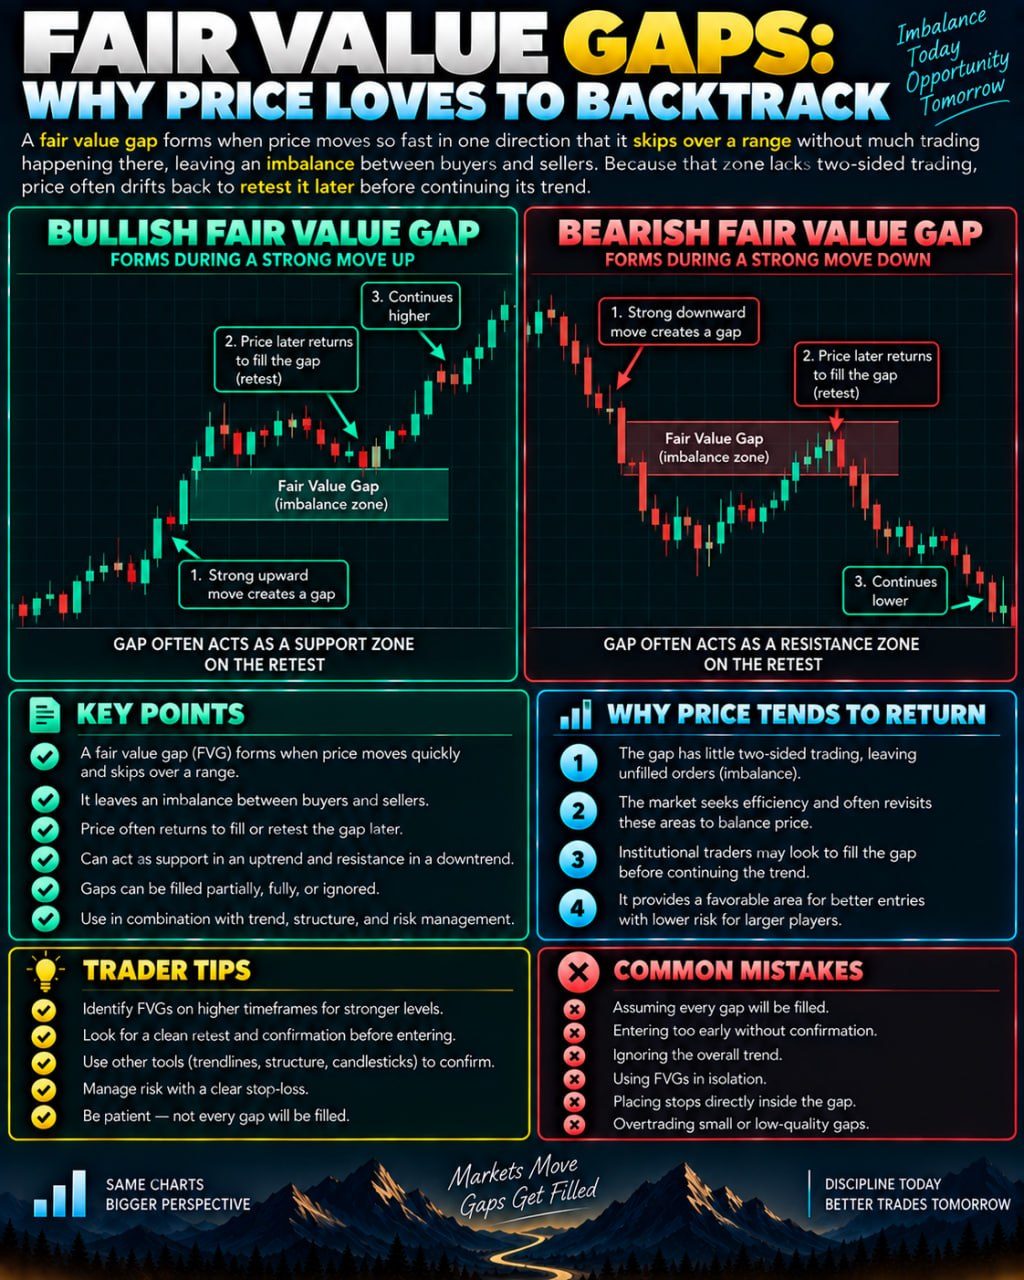
Fair Value Gap: What It Means and Why Price Revisits It
A fair value gap forms when price moves so fast in one direction that it skips over a range without much trading happening there, leaving an "imbalance" between buyers and…
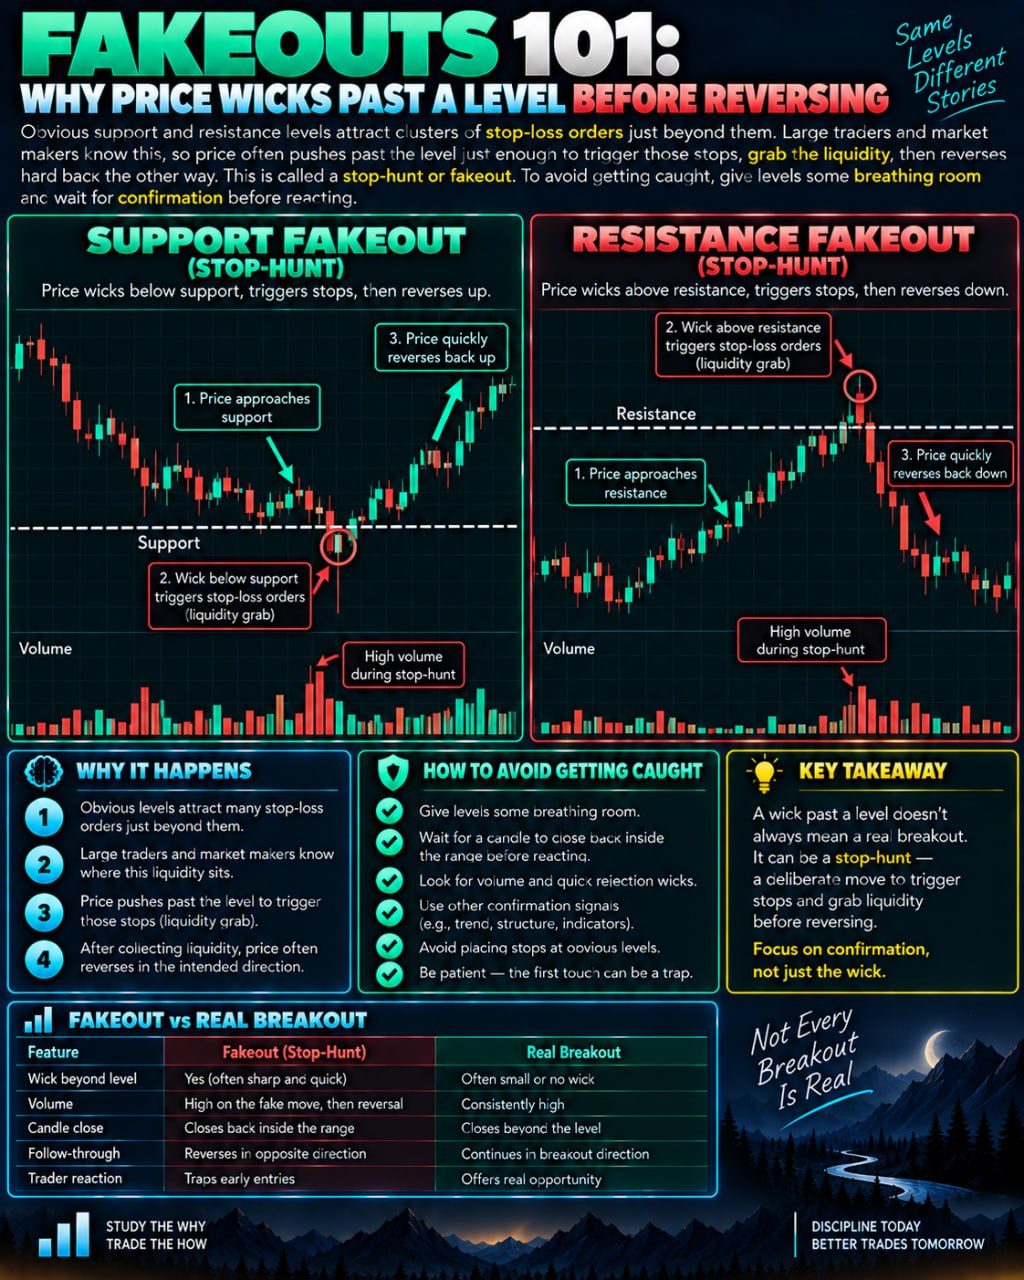
Fakeouts: Why Price Wicks Past Support or Resistance Before Reversing
Obvious support and resistance levels attract clusters of stop-loss orders just beyond them. Large traders and market makers know this, so price often pushes past the level just…
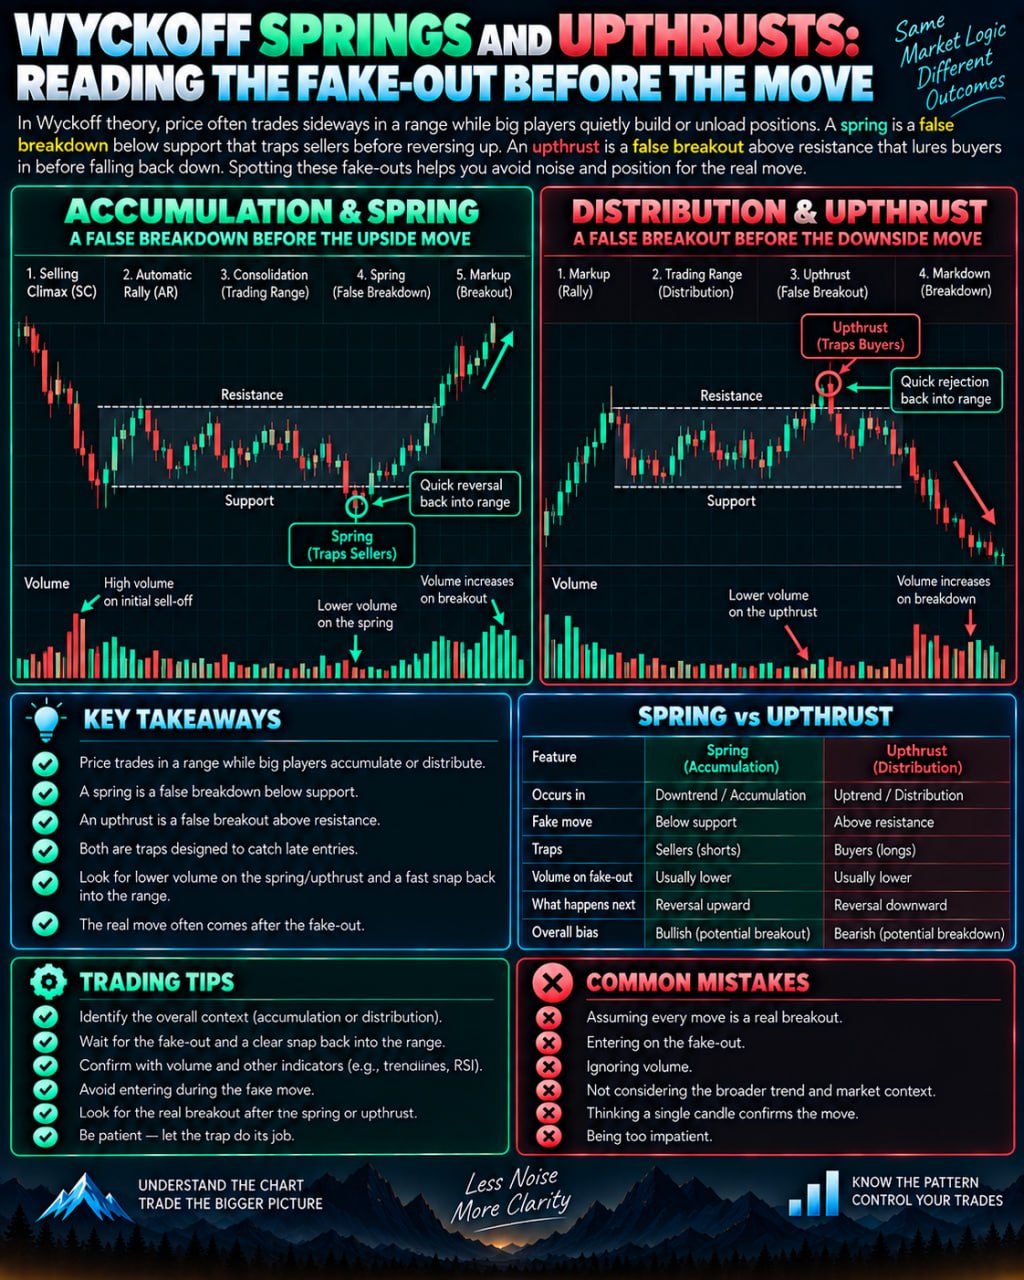
Wyckoff Spring and Upthrust: How to Spot These Fake Breakouts
In Wyckoff theory, price often trades sideways in a range while big players quietly build or unload positions. A "spring" is a brief dip below the range's support that traps…
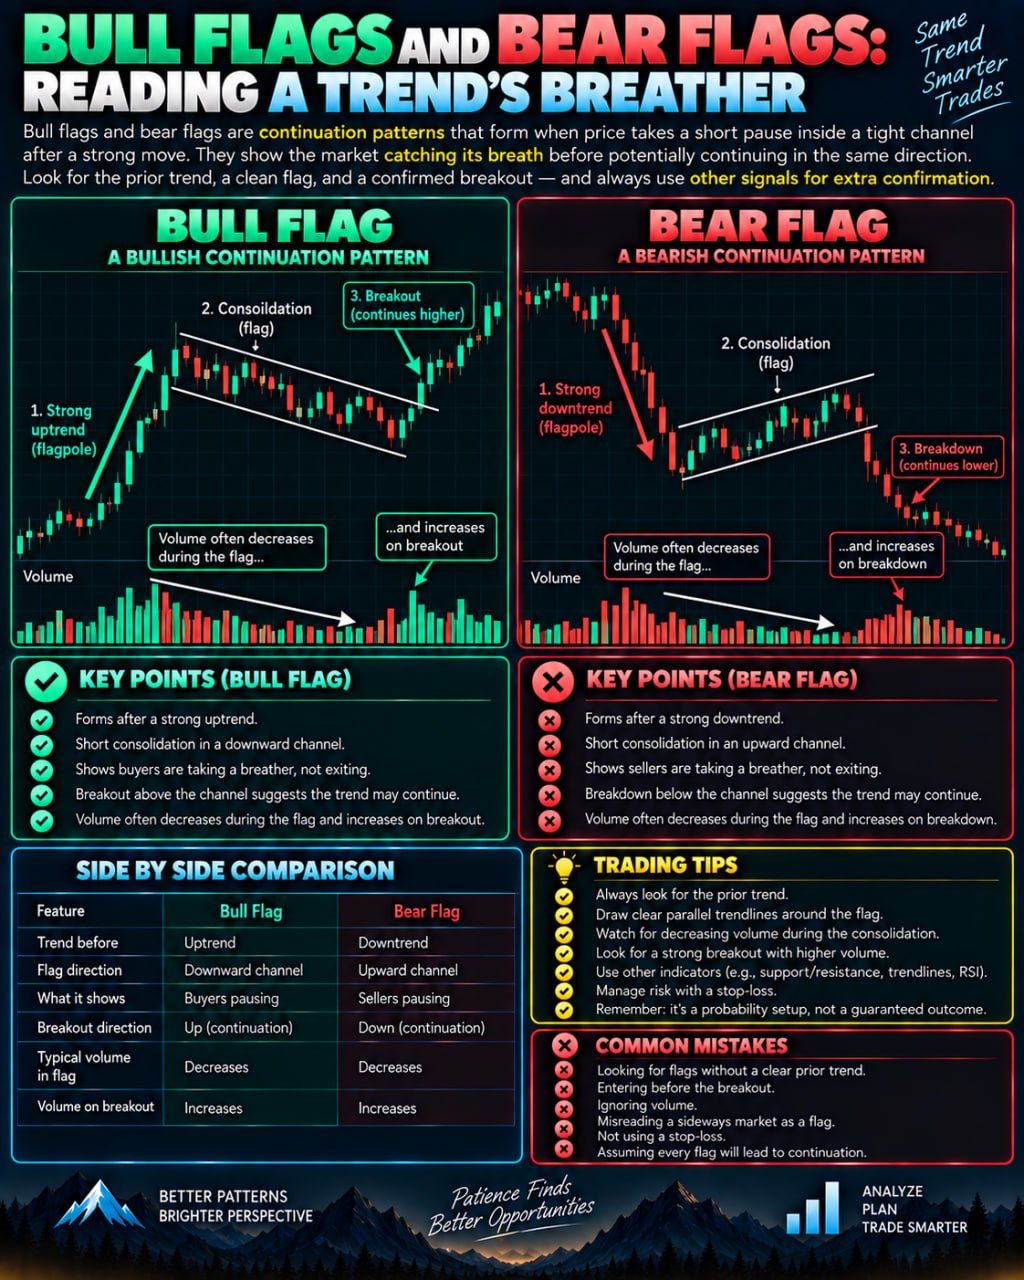
Bull Flag and Bear Flag Patterns: What They Mean in Trading
A flag forms when price makes a sharp move, then drifts sideways or slightly against that move in a tight, parallel channel — basically the market pausing to catch its breath. A…
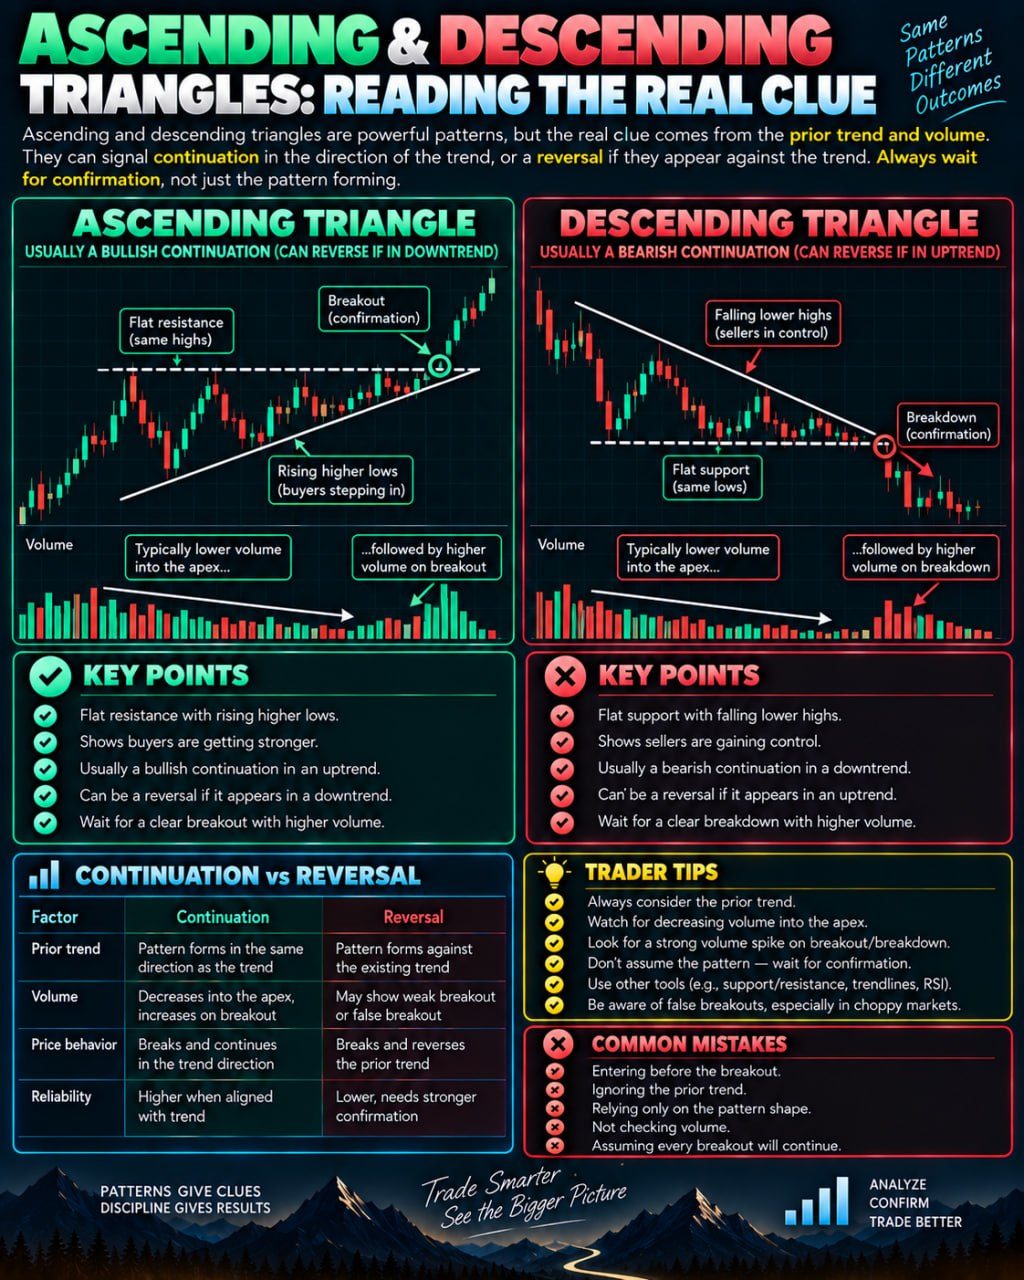
Ascending vs Descending Triangles: What the Pattern Really Signals
Ascending triangles form with a flat resistance line and rising higher lows, showing buyers stepping in more aggressively over time — usually a bullish continuation in an uptrend.…
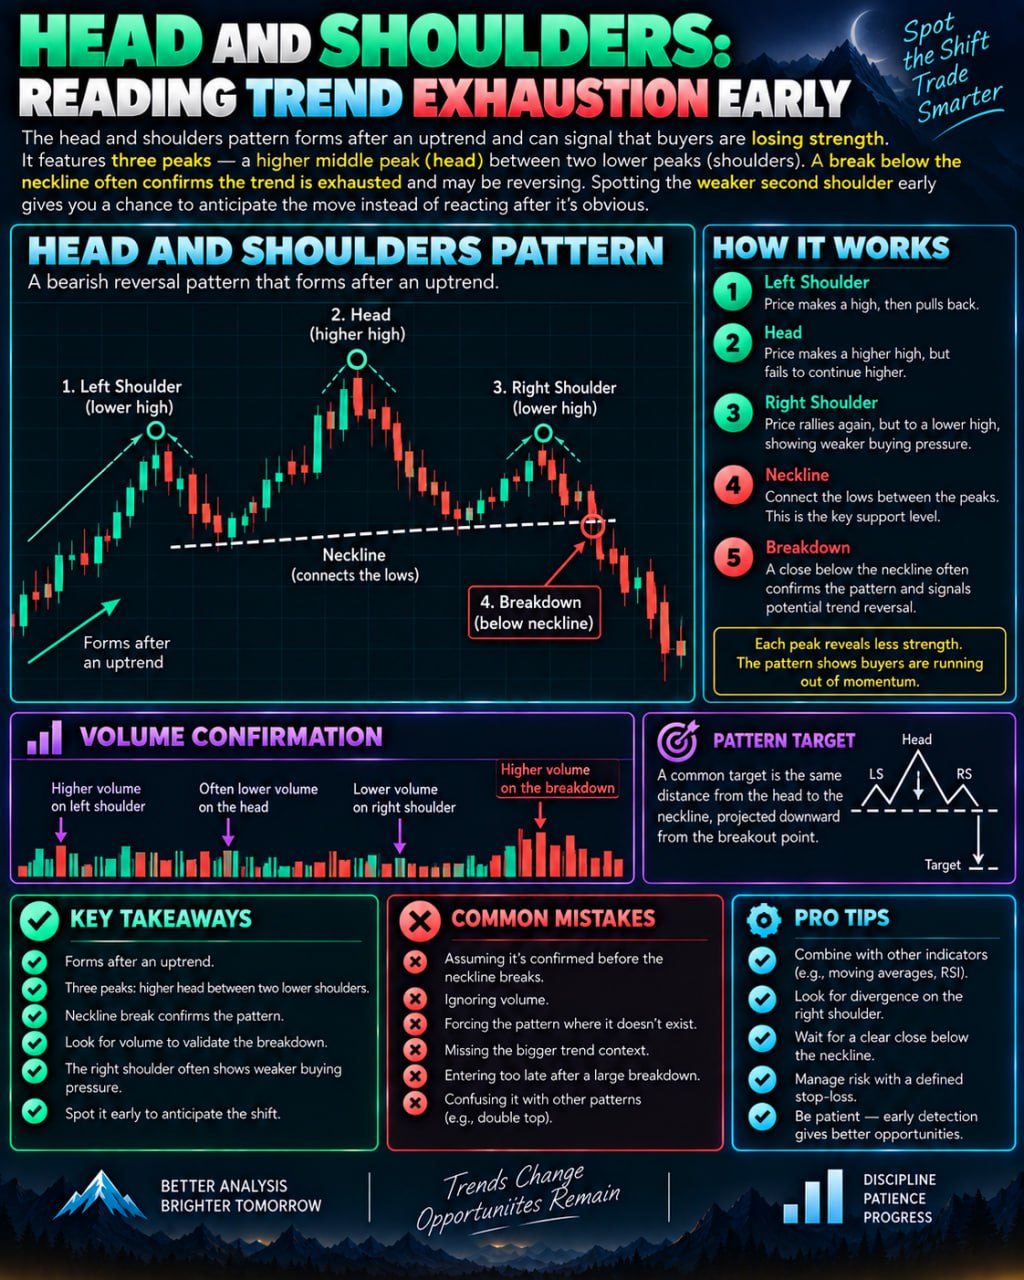
Head and Shoulders Pattern: How to Spot Trend Reversal Early
A head and shoulders pattern forms after an uptrend, with three peaks — a higher middle peak (head) flanked by two lower peaks (shoulders). Each peak fails to push much further,…
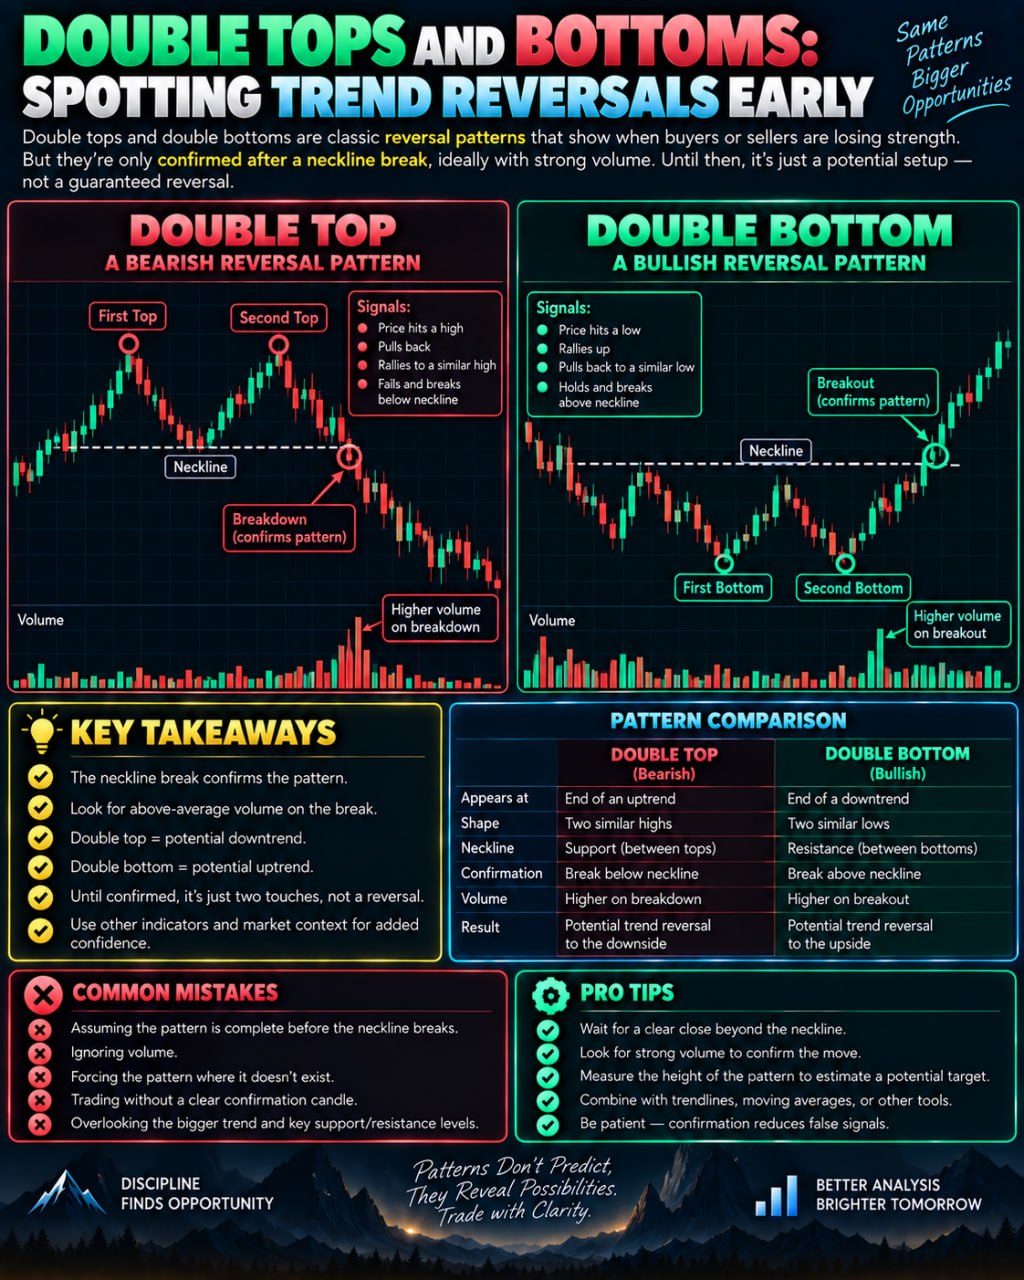
Double Top and Double Bottom Patterns: How to Trade Them
A double top forms when price hits a high, pulls back, rallies again to roughly the same high, then fails — signaling buyers are losing strength. A double bottom is the mirror…
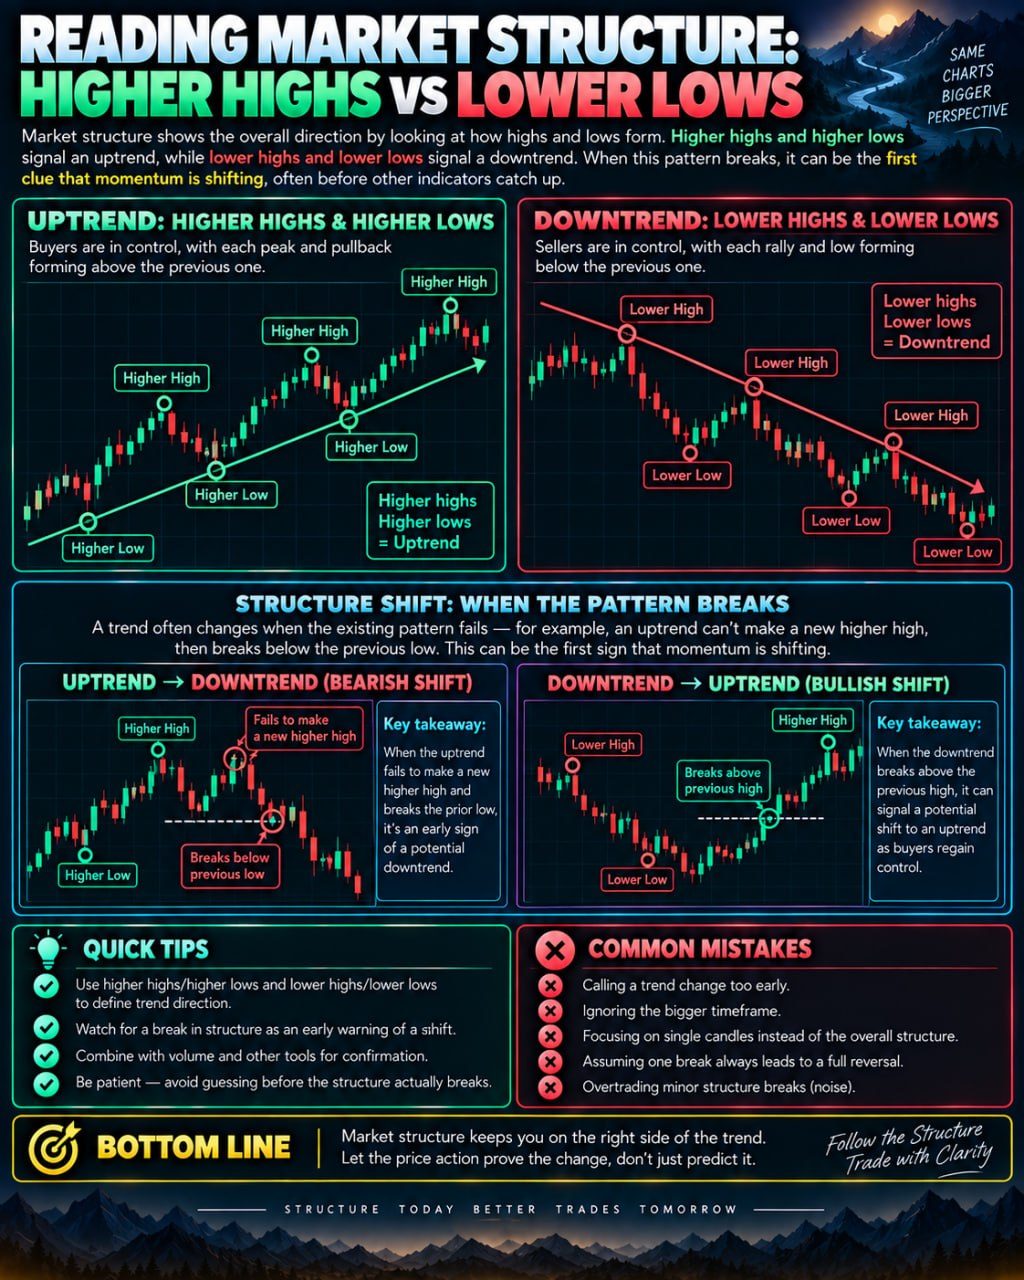
Higher Highs vs Lower Lows: Reading Market Structure
An uptrend is defined by higher highs and higher lows — each price peak and each pullback lands above the last one, showing buyers stepping in earlier each time. A downtrend flips…
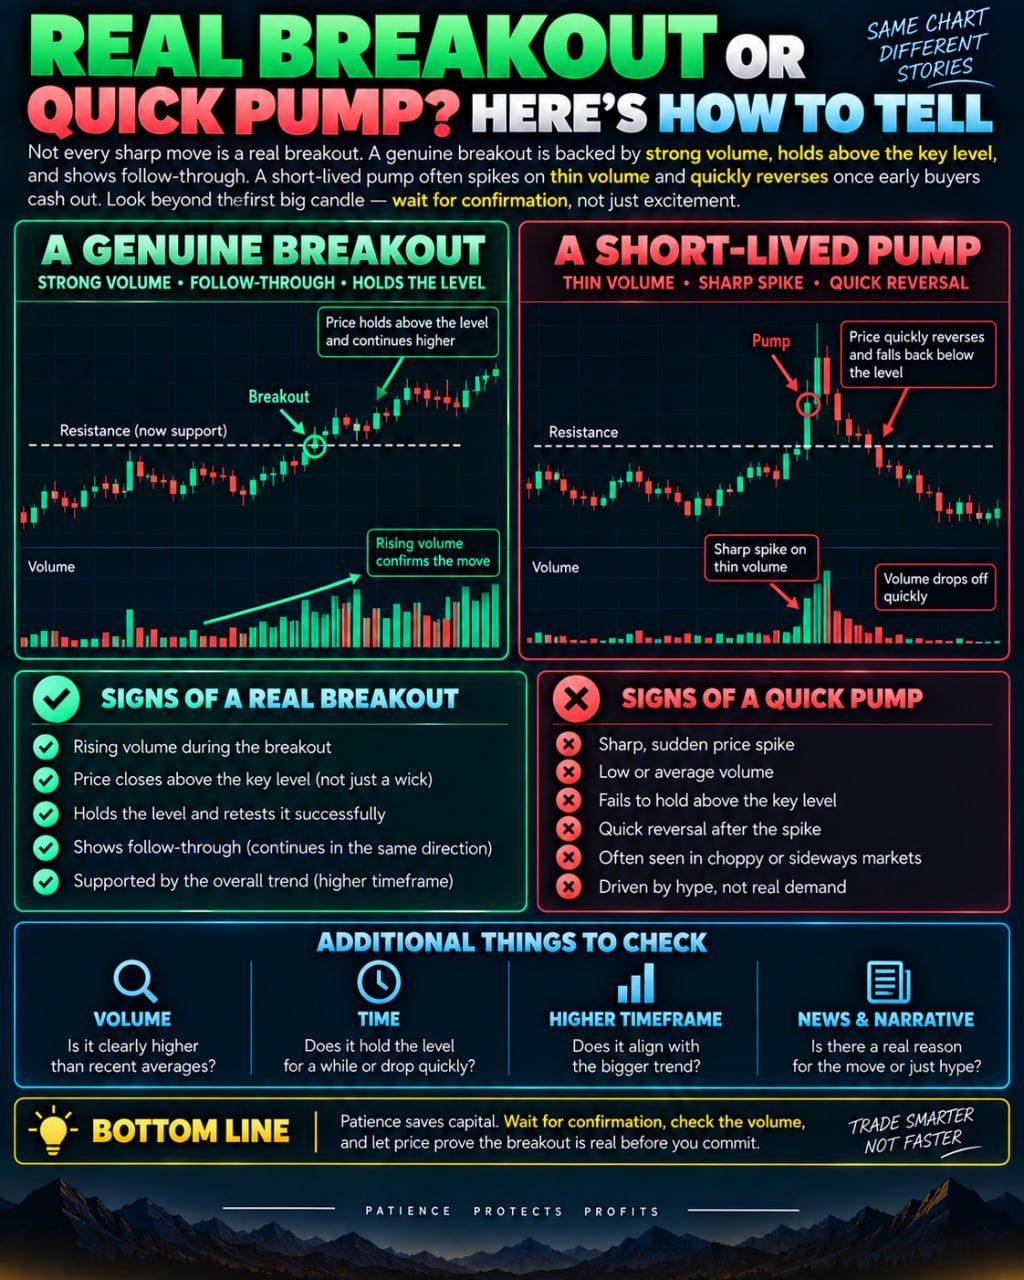
Real Breakout vs Fakeout: How to Tell With Volume and Price
A genuine breakout usually comes with rising volume, as more traders confirm the move with real buying or selling. A short-lived pump often shows a sharp price spike on thin…
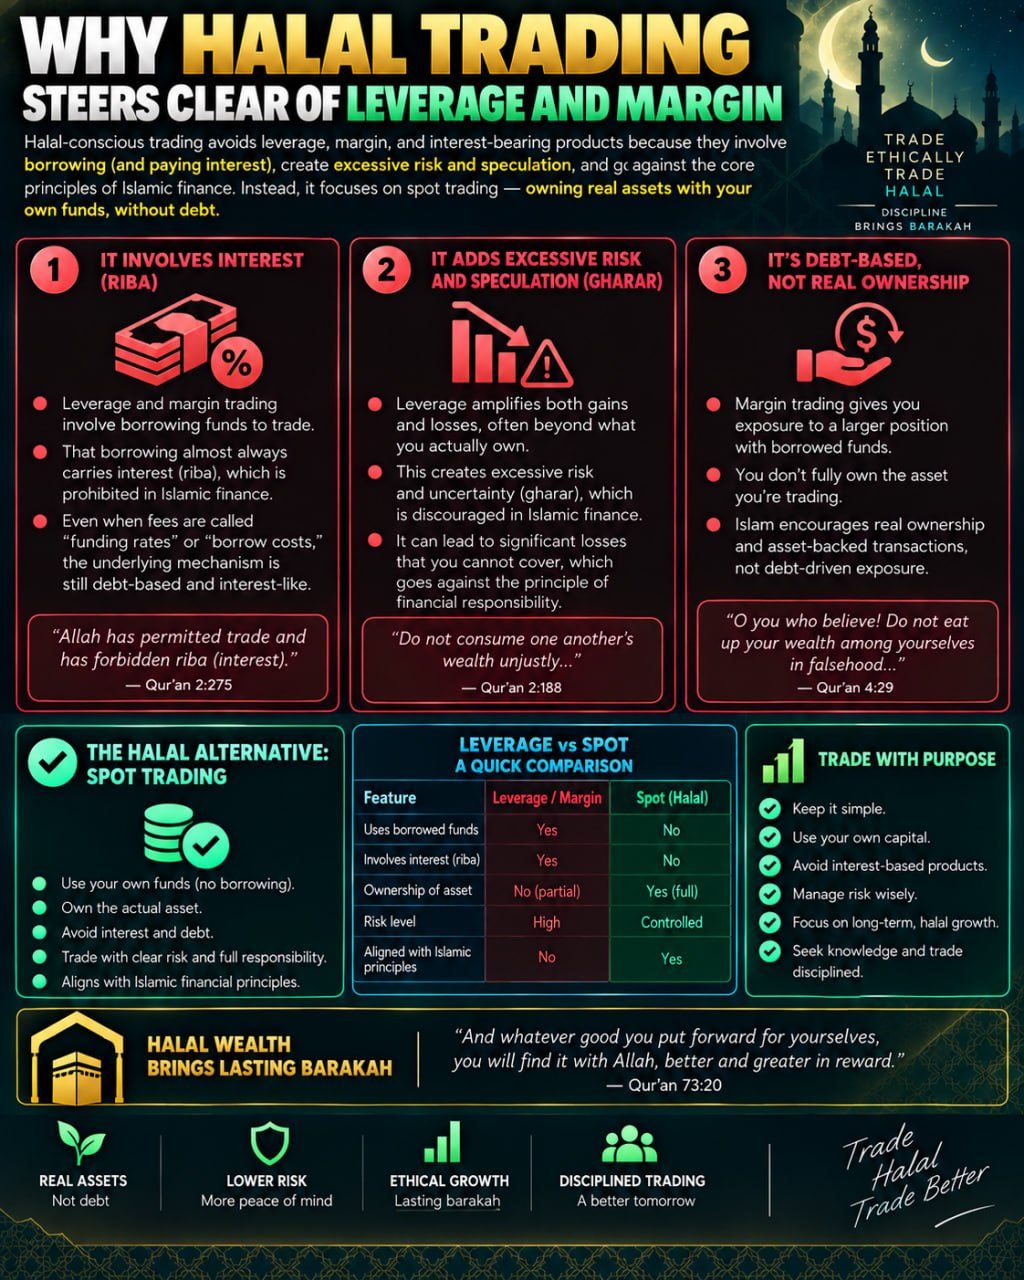
Why Halal Trading Avoids Leverage and Margin
Leverage and margin trading involve borrowing funds to trade, and that borrowing almost always carries interest (riba), which is prohibited in Islamic finance. Even when fees are…
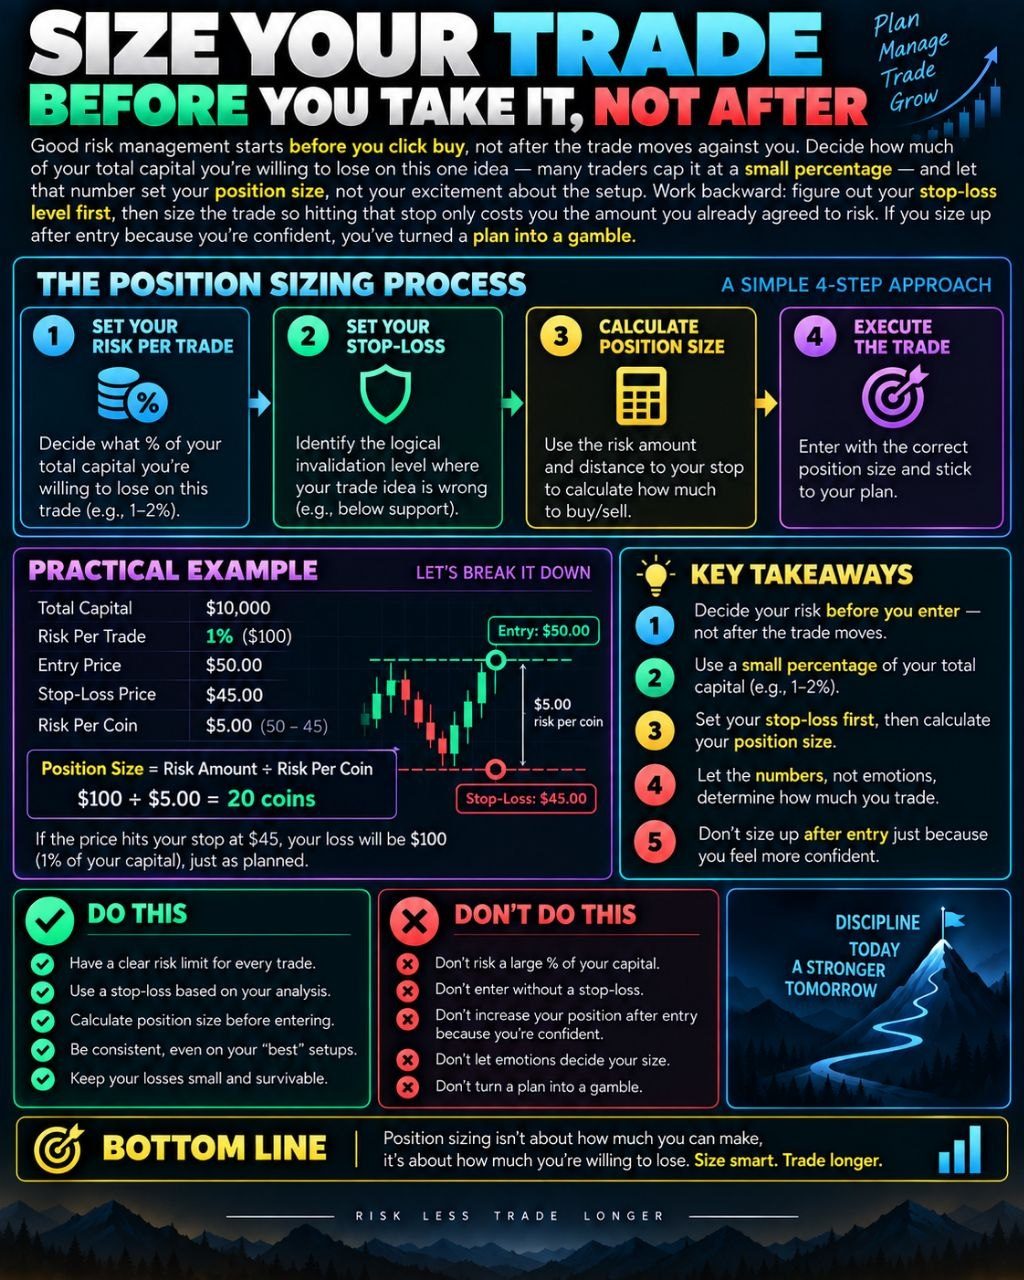
Position Sizing in Trading: Why You Must Size Before You Enter
Good risk management starts before you click buy, not after the trade moves against you. Decide how much of your total capital you're willing to lose on this one idea — many…
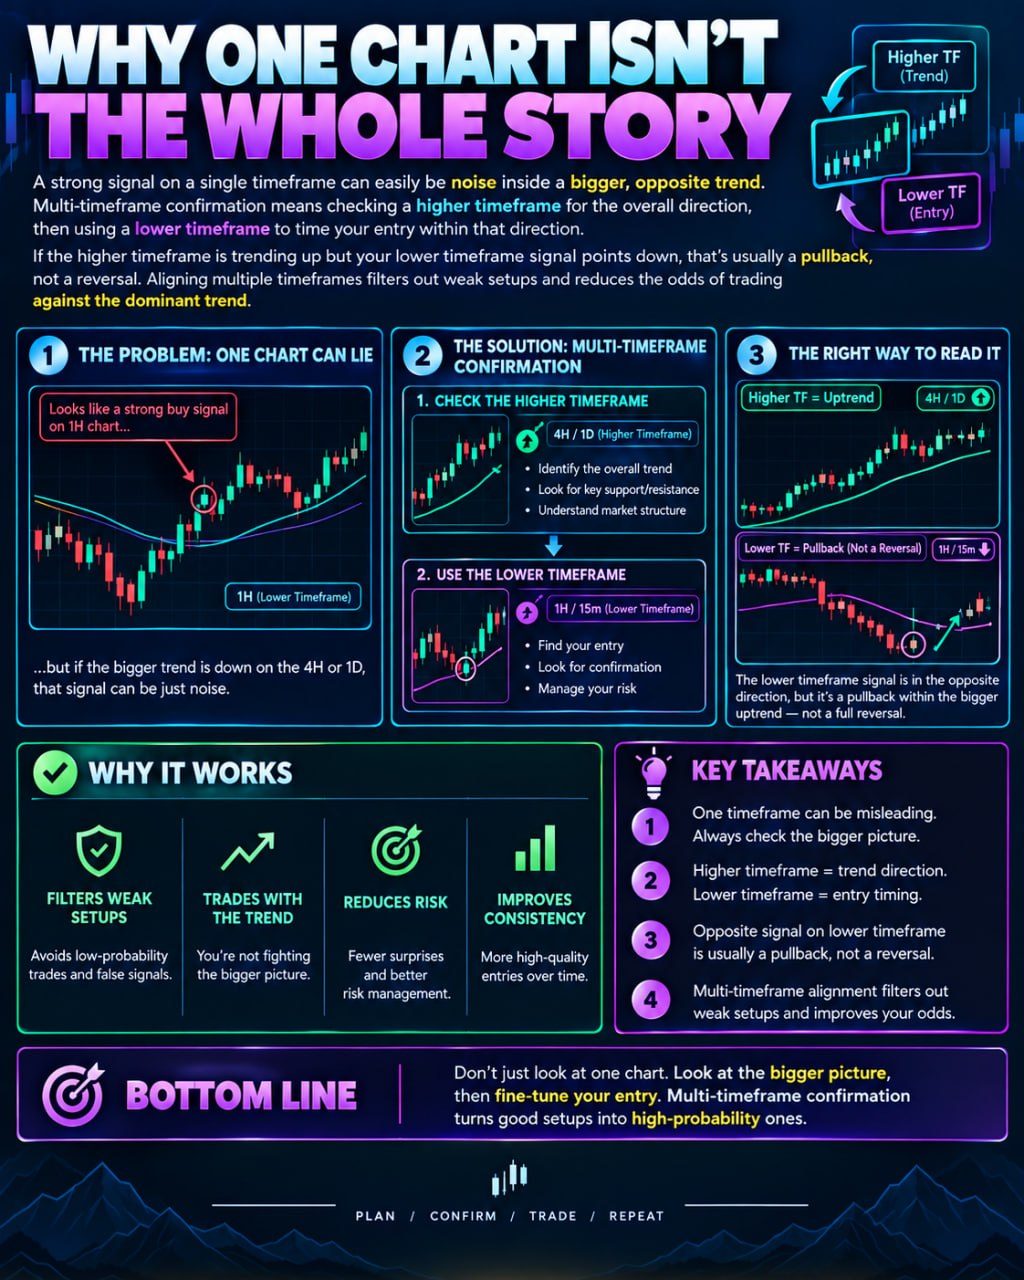
Multi-Timeframe Analysis: Why One Chart Isn't Enough
A strong signal on a single timeframe can easily be noise inside a bigger, opposite trend. Multi-timeframe confirmation means checking a higher timeframe for the overall…
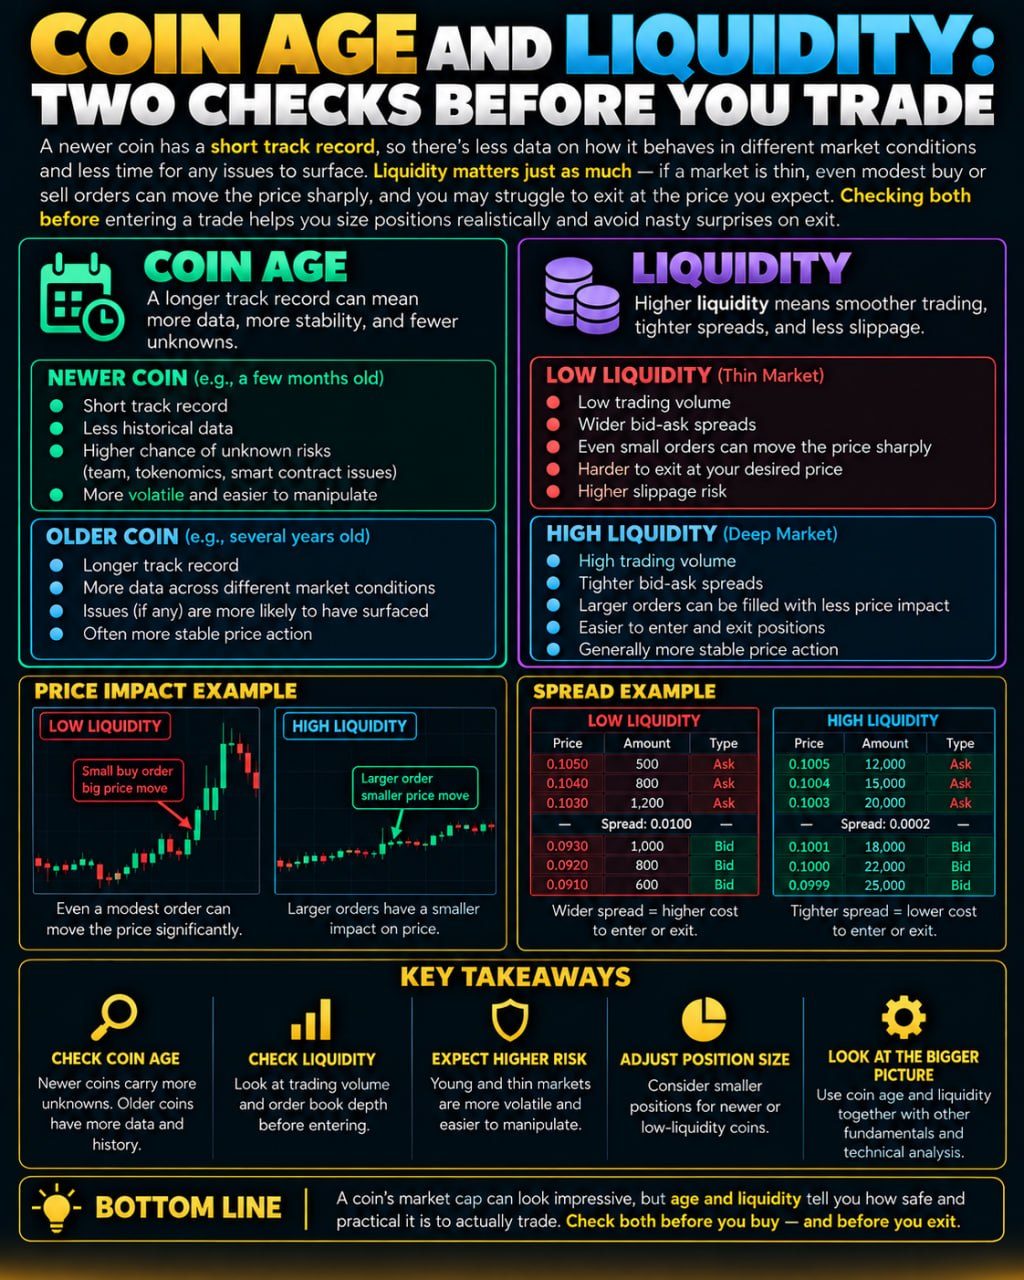
Coin Age and Liquidity: What to Check Before Trading Crypto
A newer coin has a short track record, so there's less data on how it behaves in different market conditions and less time for any issues to surface. Liquidity matters just as…
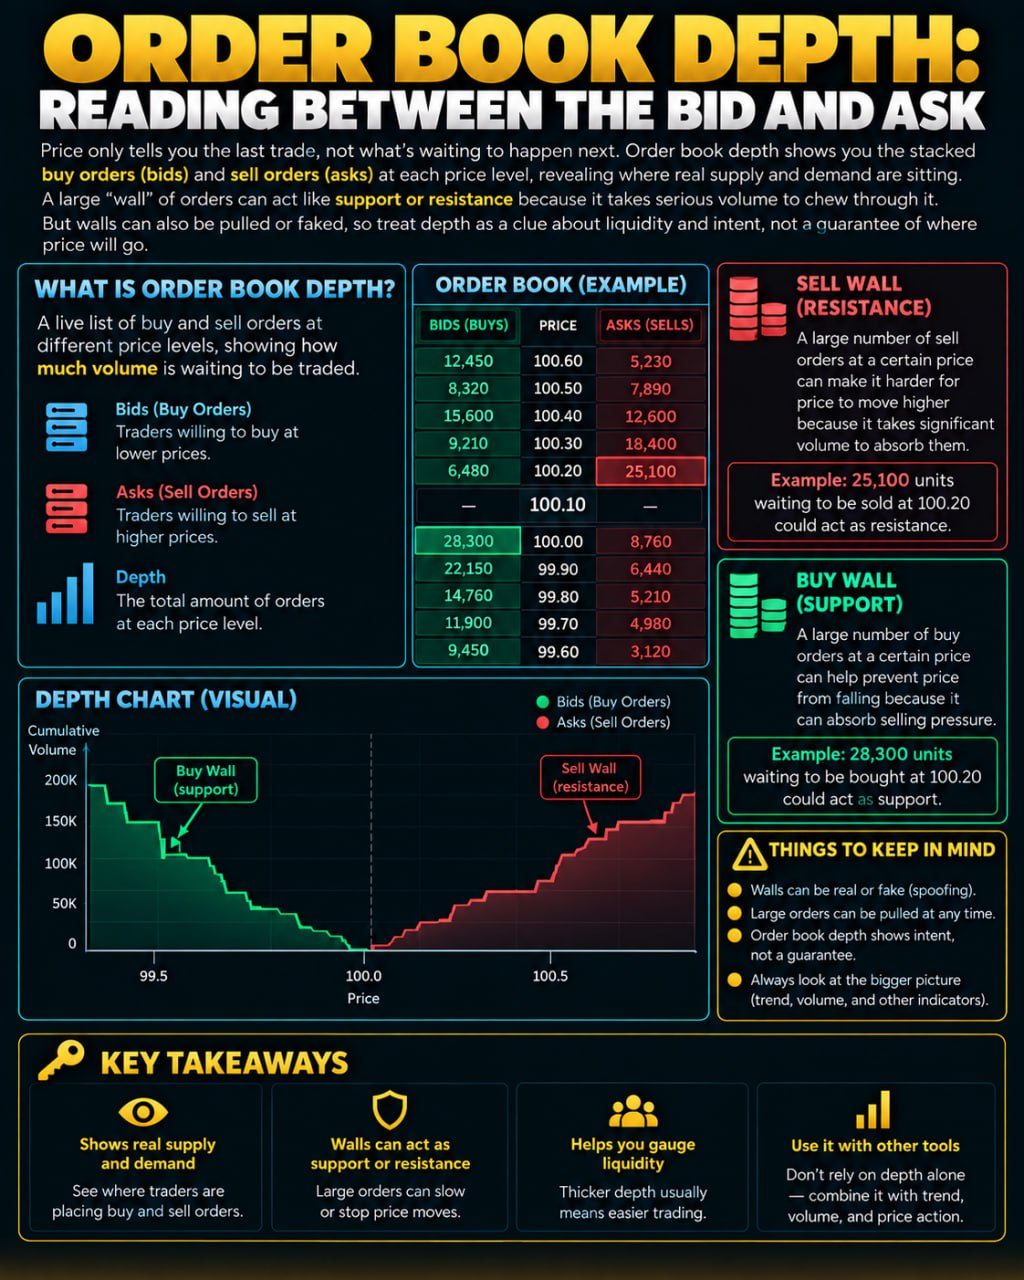
Order Book Depth: What Bid and Ask Walls Really Tell You
Price only tells you the last trade, not what's waiting to happen next. Order book depth shows you the stacked buy orders (bids) and sell orders (asks) at each price level,…
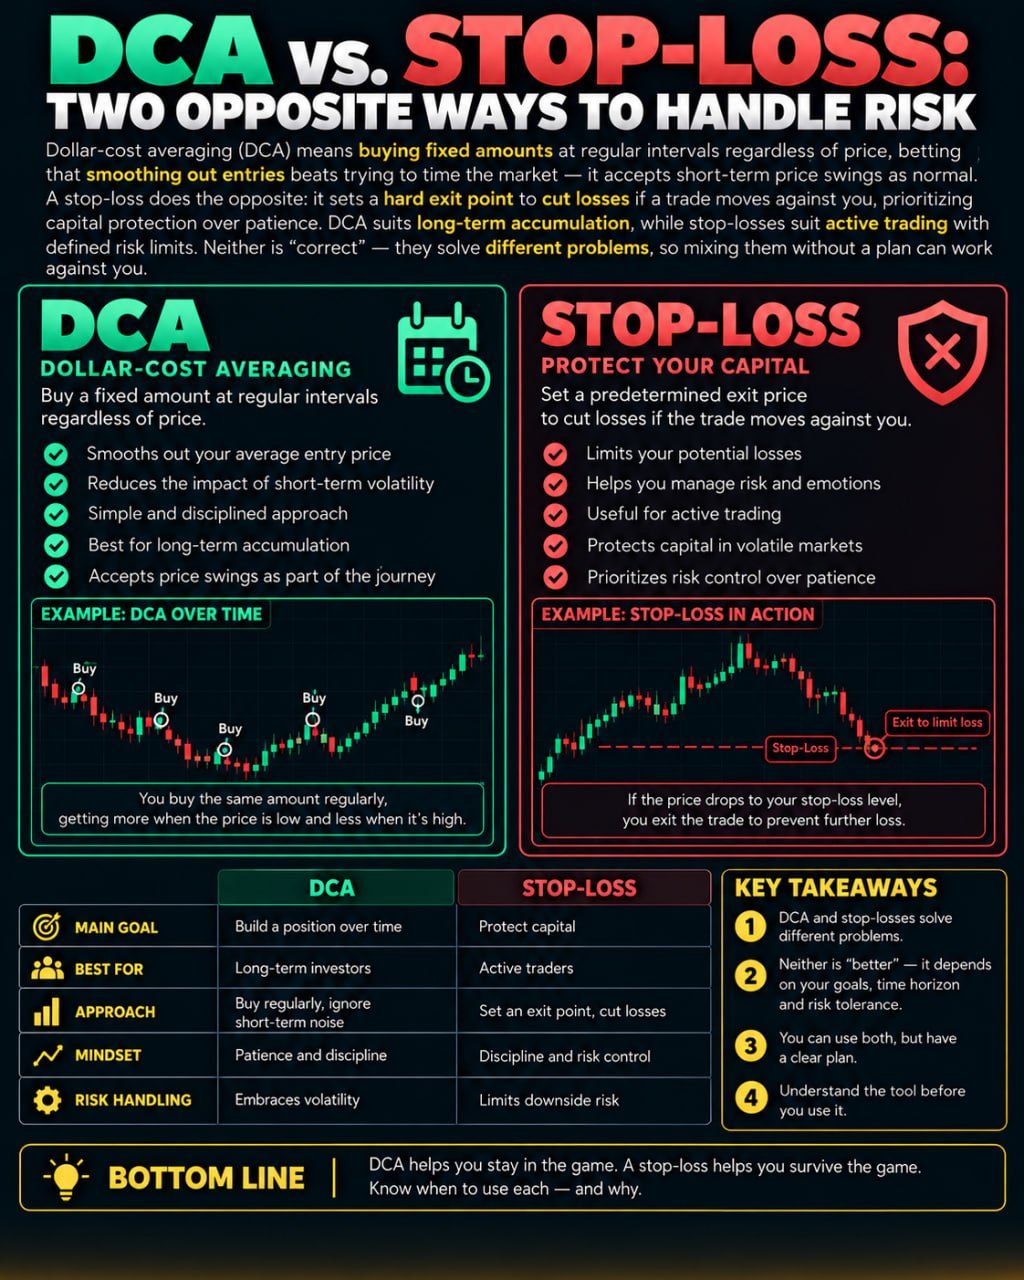
DCA vs Stop-Loss: How They Handle Risk Differently
Dollar-cost averaging means buying fixed amounts at regular intervals regardless of price, betting that smoothing out entries beats trying to time the market — it accepts…
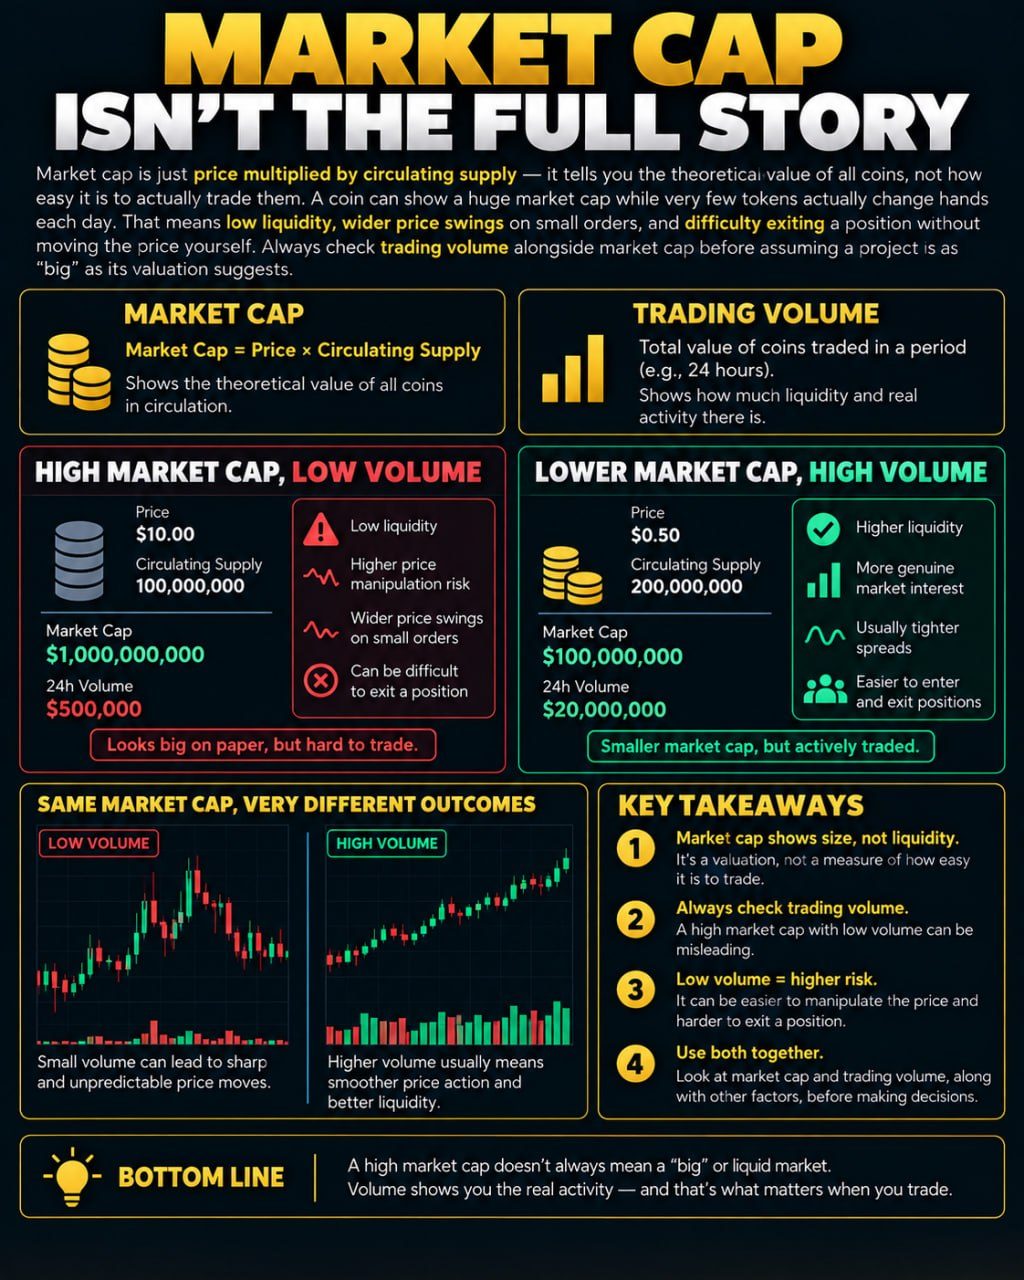
Market Cap vs Trading Volume: Why Both Metrics Matter
Market cap is just price multiplied by circulating supply — it tells you the theoretical value of all coins, not how easy it is to actually trade them. A coin can show a huge…
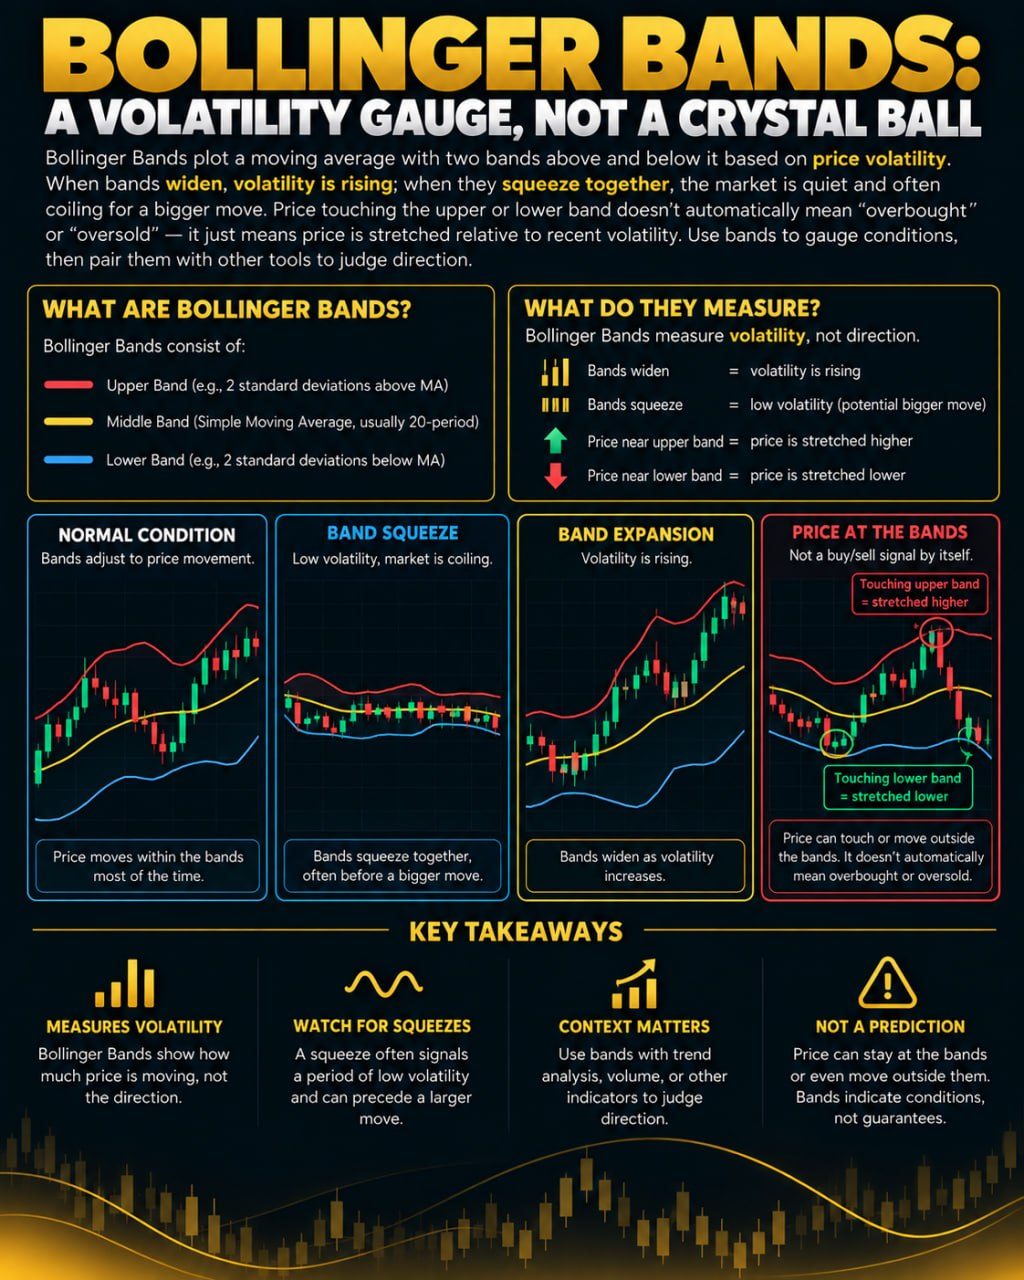
Bollinger Bands Explained: What They Measure and How to Read Them
Bollinger Bands plot a moving average with two bands above and below it based on price volatility. When bands widen, volatility is rising; when they squeeze together, the market…
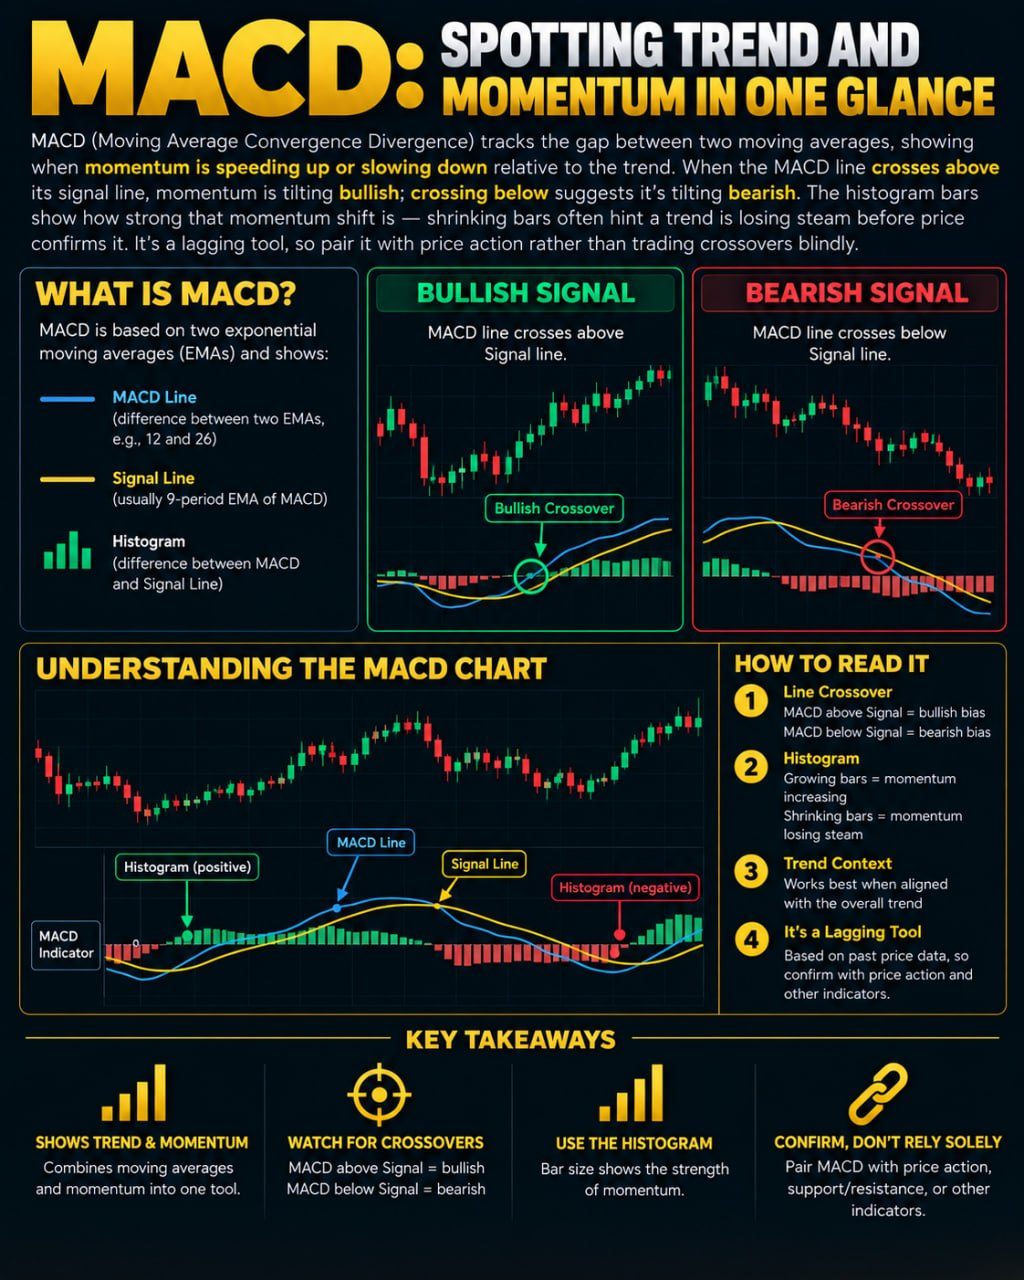
MACD Indicator: How to Read Trend and Momentum Signals
MACD tracks the gap between two moving averages, showing when momentum is speeding up or slowing down relative to the trend. When the MACD line crosses above its signal line,…
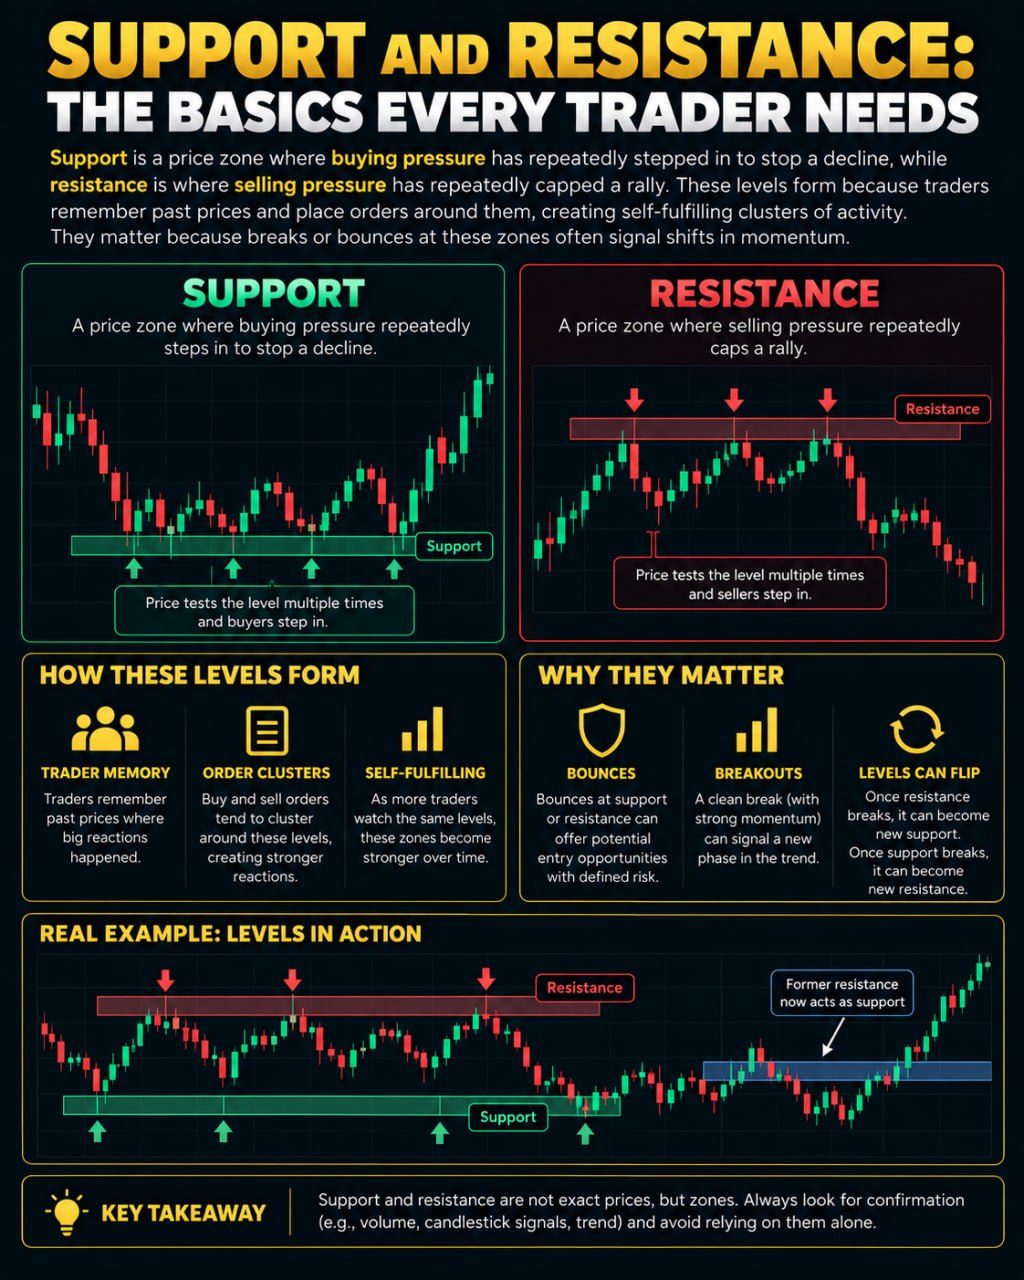
Support and Resistance Levels Explained: A Trading Basics Guide
Support is a price zone where buying pressure has repeatedly stepped in to stop a decline, while resistance is where selling pressure has repeatedly capped a rally. These levels…
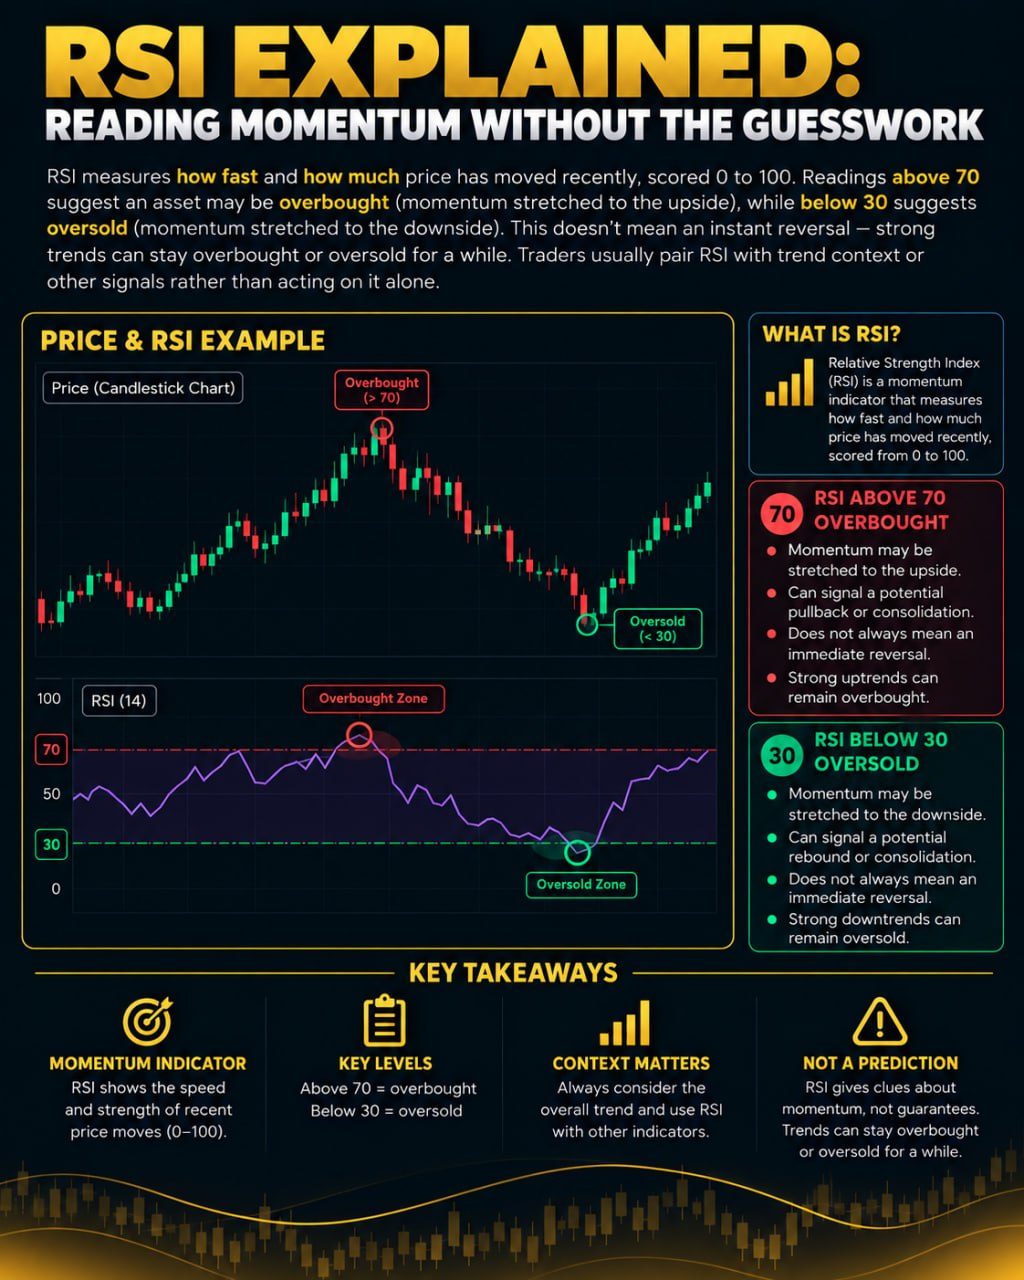
RSI Indicator Explained: Overbought, Oversold, and Divergence
RSI measures how fast and how much price has moved recently, scored 0 to 100. Readings above 70 suggest an asset may be overbought (momentum stretched to the upside), while below…
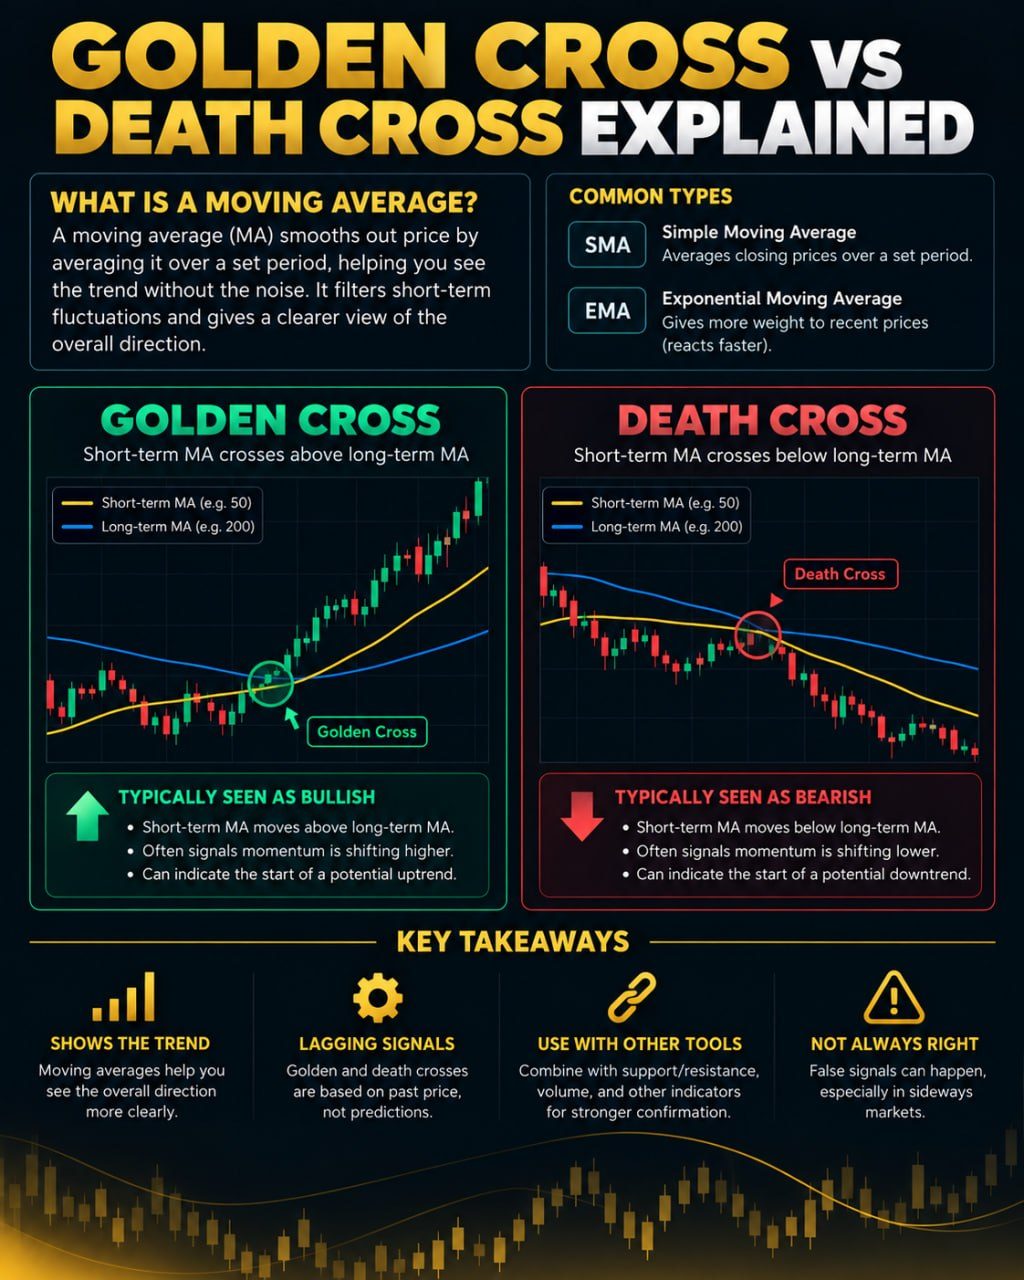
Golden Cross vs Death Cross: What They Mean for Trading
A moving average smooths out price by averaging it over a set period, helping you see the trend without the noise. A "golden cross" happens when a shorter-term moving average…
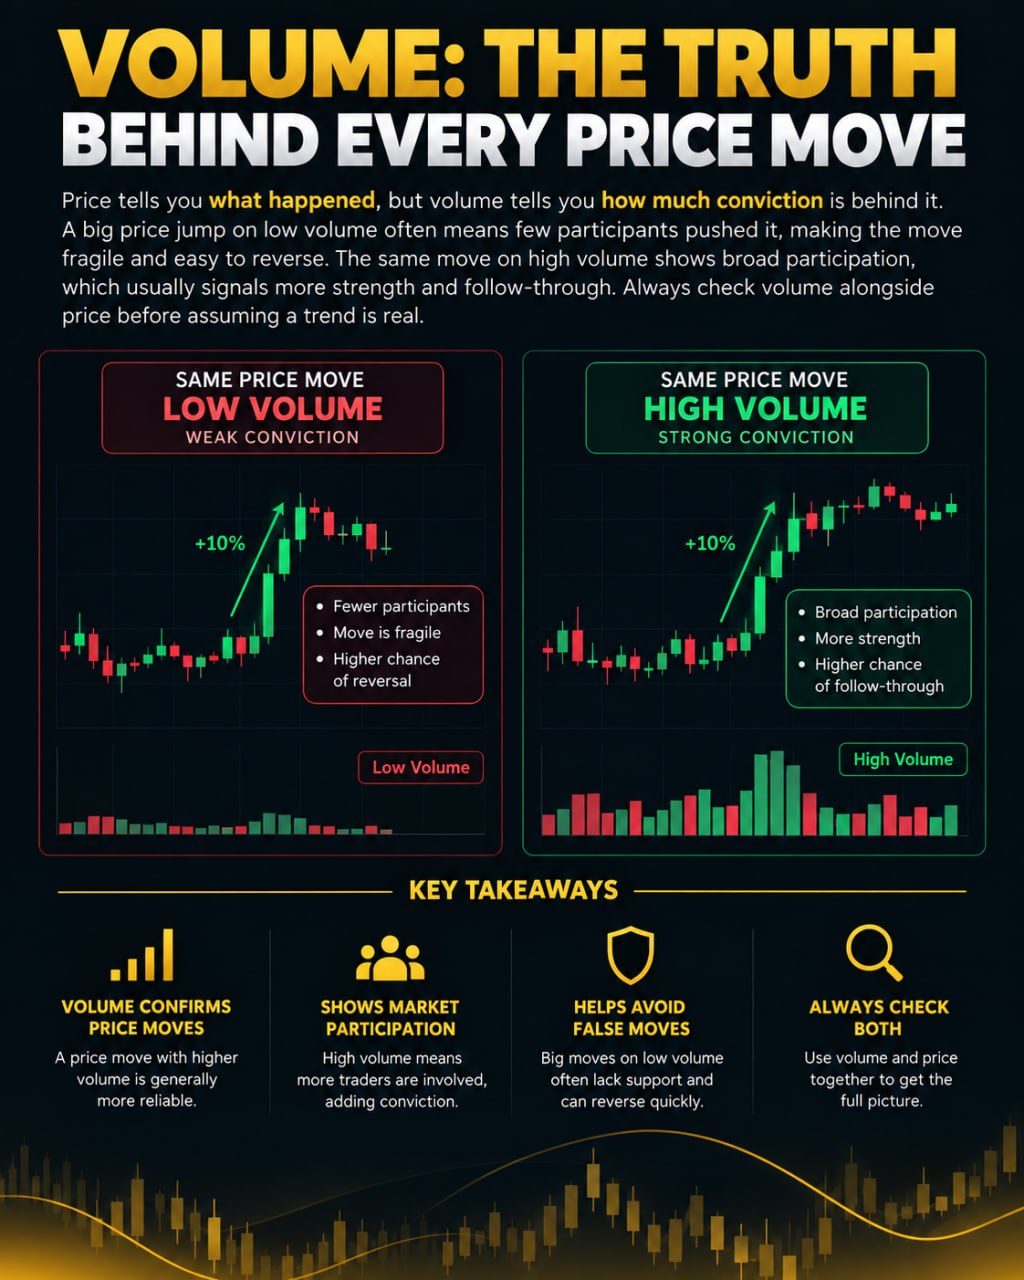
Trading Volume: What It Measures and Why It Matters
Price tells you what happened, but volume tells you how much conviction is behind it. A big price jump on low volume often means few participants pushed it, making the move…
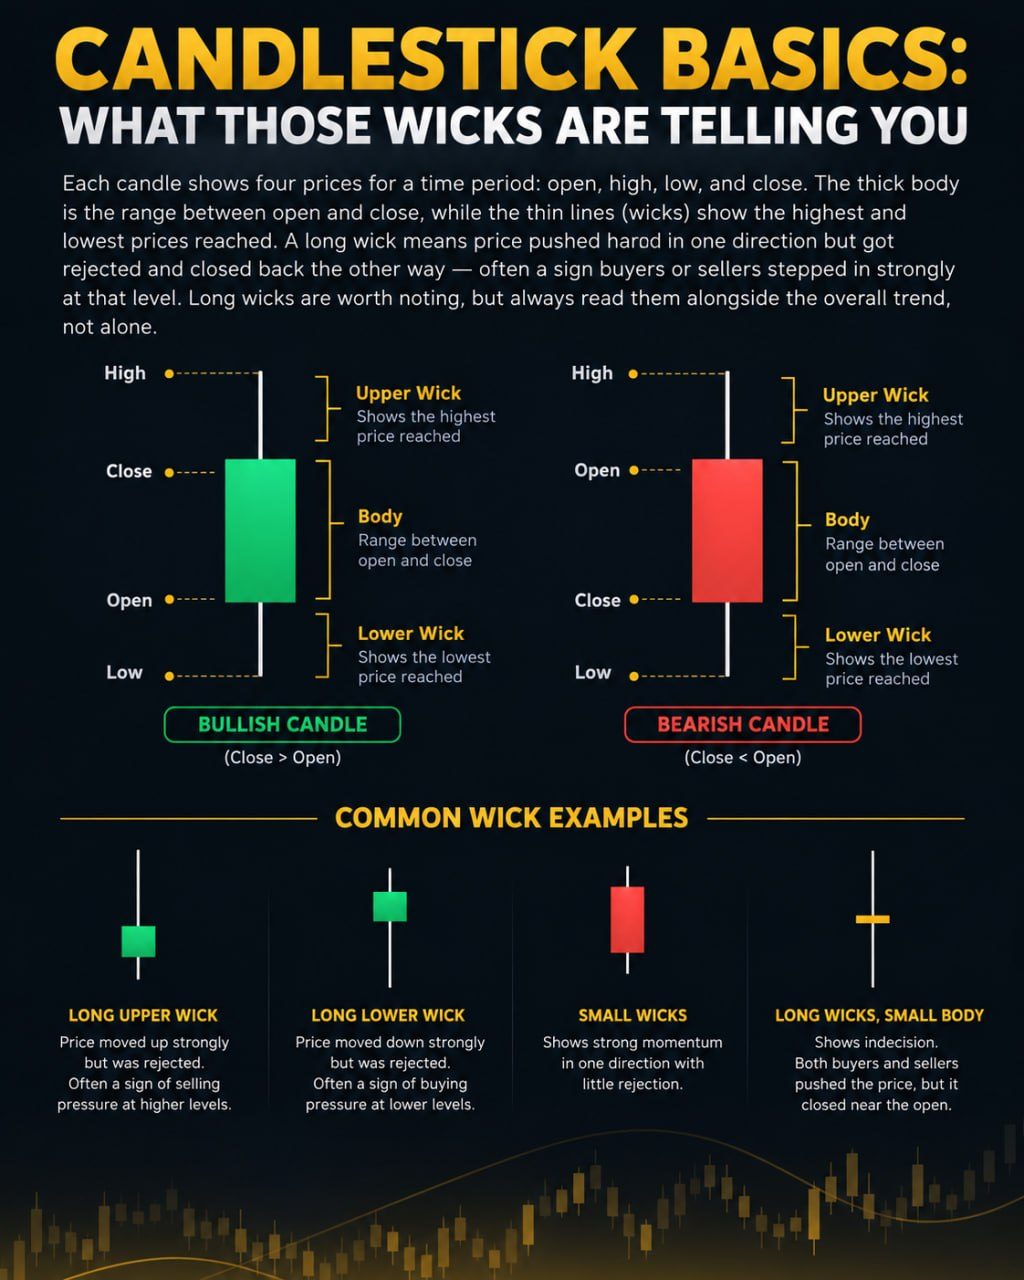
Candlestick Wicks Explained: What They Mean in Trading
Each candle shows four prices for a time period: open, high, low, and close. The thick body is the range between open and close, while the thin lines (wicks) show the highest and…