
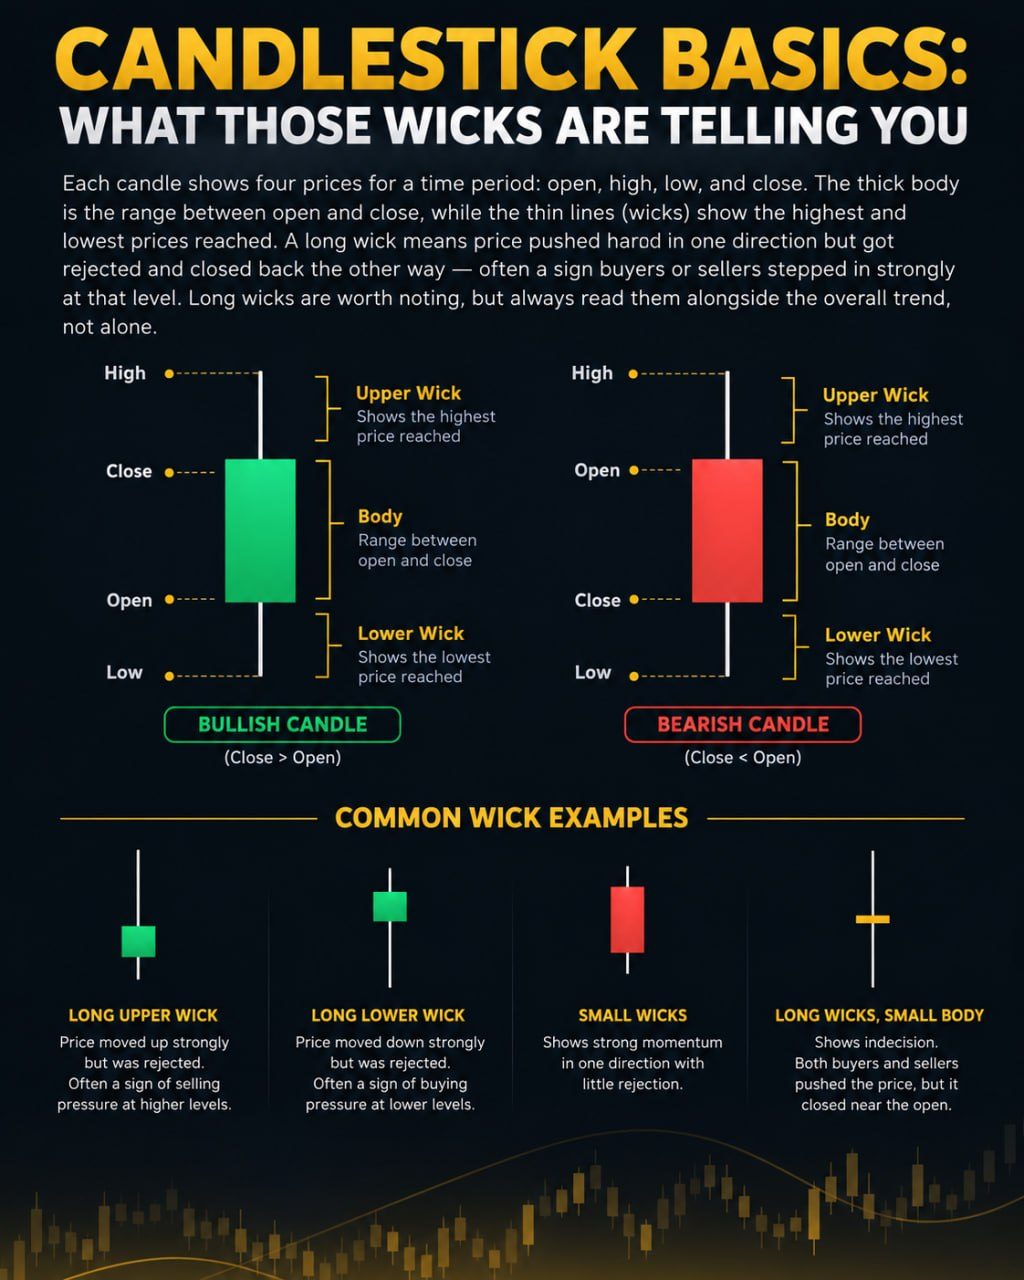
Each candle shows four prices for a time period: open, high, low, and close. The thick body is the range between open and close, while the thin lines (wicks) show the highest and lowest prices reached. A long wick means price pushed hard in one direction but got rejected and closed back the other way — often a sign buyers or sellers stepped in strongly at that level. Long wicks are worth noting, but always read them alongside the overall trend, not alone.
Reading The Four Prices In One Candle
A candlestick is a small picture of price behavior over a set period of time, whether that period is one minute, one hour, or one day. Every candle carries four data points: the open, the price when the period started; the close, the price when it ended; the high, the highest price touched during that period; and the low, the lowest price touched. The thick part of the candle, called the body, shows the distance between the open and the close. If the close is higher than the open, the body is usually colored one way, often green or white; if the close is lower than the open, it is usually colored the opposite way, often red or black.
The thin lines extending above and below the body are called wicks or shadows. They show how far price traveled beyond the open-close range before snapping back. A candle with almost no wick means price moved in mostly one direction and stayed there. A candle with long wicks on both ends means price was volatile, testing both higher and lower levels before settling near where it started.
What A Long Wick Usually Suggests
A long wick on the top of a candle means buyers pushed price up during that period, but sellers came in strong enough to drag the close back down, so the price failed to hold the highs. A long wick on the bottom means the opposite: sellers pushed price down, but buyers stepped in and pulled the close back up. Traders often read these as moments of rejection, where the market tried to move in one direction and was pushed back the other way.
This rejection can hint that a level attracted a lot of trading interest, whether from large orders, profit-taking, or simply a lot of participants disagreeing on value at that price. It does not tell you why the rejection happened, only that it did.
Why Wicks Alone Are Not Enough
A single wick is just one snapshot in time. Imagine a coin trading around 100 that prints a candle with a long wick down to 90 before closing back near 100. On its own, this might look like a strong buying signal. But if the broader trend is firmly downward, that same wick could simply be noise inside a larger decline, not a genuine turning point.
Context matters more than any single candle. Traders generally look at wicks alongside the surrounding trend, nearby support and resistance levels, which are price zones where reversals have happened before, and overall volume, meaning how much trading activity occurred. A long wick appearing near a well established level carries more weight than one appearing in the middle of nowhere.
Common Mistakes Traders Make
A frequent error is treating every long wick as a guaranteed reversal signal and entering trades based on one candle alone. Markets are noisy, and a wick can be followed by more of the same movement rather than a turnaround. Another mistake is ignoring the timeframe; a long wick on a one minute chart is a much smaller event than one on a daily chart, yet beginners sometimes weigh them equally.
It also helps to remember that candlestick patterns are descriptive, not predictive. They summarize what already happened, not what will happen next.
Fitting Candles Into A Broader Approach
Most experienced traders use candlestick wicks as one input among several, combined with trend analysis, support and resistance, and other indicators, alongside firm risk management such as position sizing and stop losses. No single candle, pattern, or indicator can guarantee an outcome, and past rejections at a price level do not promise future ones. Treat wick analysis as a way to build a more informed picture, not as a shortcut to certainty.