
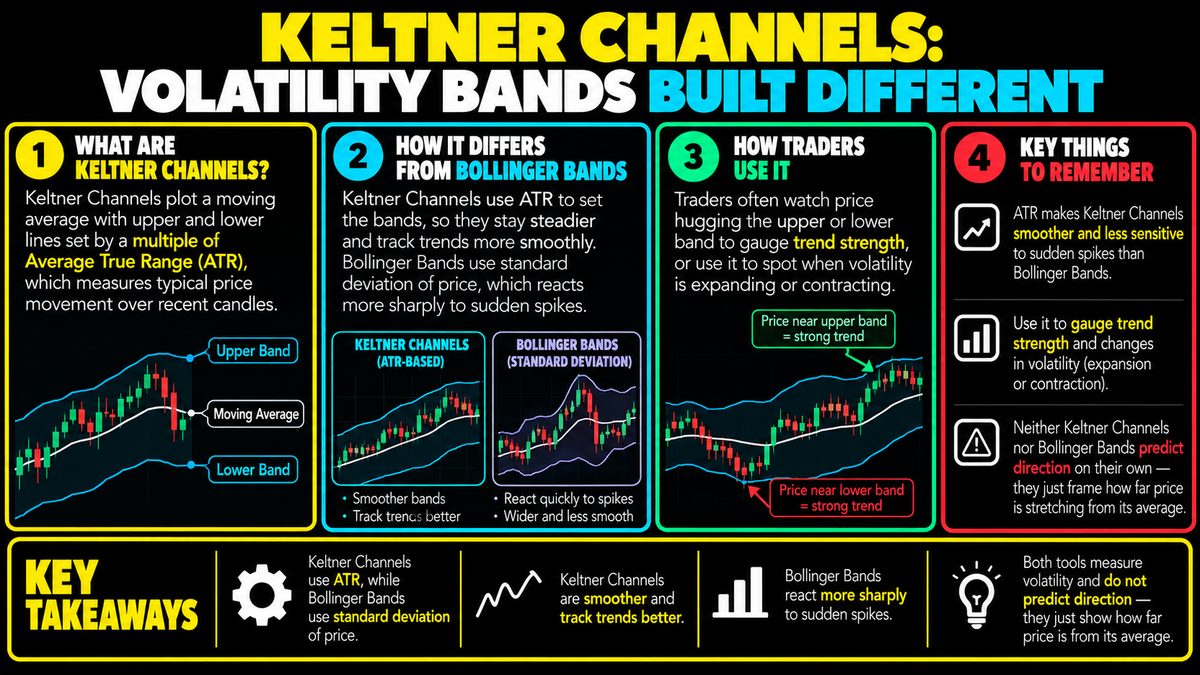
Keltner Channels plot a moving average with upper and lower lines set by a multiple of Average True Range (ATR), which measures typical price movement over recent candles. Unlike Bollinger Bands, which use standard deviation of price and react sharply to sudden spikes, ATR smooths out volatility, so Keltner lines stay steadier and track trends more smoothly. Traders often watch price hugging the upper or lower band to gauge trend strength, or use it to spot when volatility is expanding or contracting. Neither tool predicts direction alone — they just frame how far price is stretching from its average.
What Keltner Channels Actually Measure
A Keltner Channel is built from three lines on a price chart. The middle line is usually an exponential moving average, which is just a line that tracks the average price over a chosen number of candles, giving more weight to recent price action. The upper and lower lines sit a certain distance above and below that average, and that distance is set using Average True Range, or ATR. ATR looks at recent candles and calculates how much price typically moves from high to low, including gaps between candles, then averages that over time. So instead of measuring how scattered prices are statistically, Keltner Channels measure how much price has actually been traveling, candle by candle.
Because ATR is itself a smoothed average, the channel width changes gradually rather than jumping around. If a coin suddenly has one huge candle, a Keltner Channel will widen only a little, since that single candle is just one input blended into a longer average. This is the main structural difference from Bollinger Bands, which use standard deviation of closing prices and can balloon outward immediately after a sharp spike.
How the Bands Respond to Market Conditions
When a market is trending steadily in one direction, price will often ride along the upper or lower band for an extended stretch. Traders sometimes read this as a sign of trend strength, since price staying pinned near a band suggests consistent directional pressure rather than a market swinging back and forth around the average. When price instead oscillates between the two bands without leaning on either one, that is often read as a ranging or directionless market.
Channel width itself is also informational. A narrowing channel suggests ATR is falling, meaning recent candles have had smaller ranges, which traders sometimes associate with a lull before a bigger move. A widening channel suggests price swings are getting larger, which can mean a trend is accelerating or that volatility is simply picking up without a clear direction.
Common Ways Traders Use the Tool
Some traders use a touch or break of the upper band as a rough visual cue that price is stretched relative to recent volatility, and a touch of the lower band as the opposite. Others use the middle average line as a reference point, watching whether price stays consistently above or below it to judge the dominant short-term trend. Because the bands adjust with ATR rather than snapping to single outlier candles, some traders prefer Keltner Channels for trend-following approaches, while they might prefer Bollinger Bands for strategies built around sudden volatility bursts.
Limitations and Common Mistakes
A common error is treating a touch of the upper or lower band as an automatic signal to expect a reversal. Price can hug a band for a long time during a strong trend, and reading every touch as "overstretched" can lead to fighting a trend that simply continues. Keltner Channels also lag, since both the moving average and ATR are built from past candles, so the bands describe recent conditions rather than forecasting what comes next. No version of this tool indicates direction with certainty; it only frames how far price has moved relative to its own recent behavior.
Fitting It Into a Broader Approach
Because Keltner Channels describe volatility and trend context rather than timing entries precisely, traders often pair them with momentum indicators, support and resistance levels, or volume analysis to build a fuller picture. Position sizing and stop-loss placement remain separate decisions that this tool does not make for you. Like any indicator, it works with probabilities and historical behavior, not guarantees, and should be treated as one input among several rather than a standalone system.