
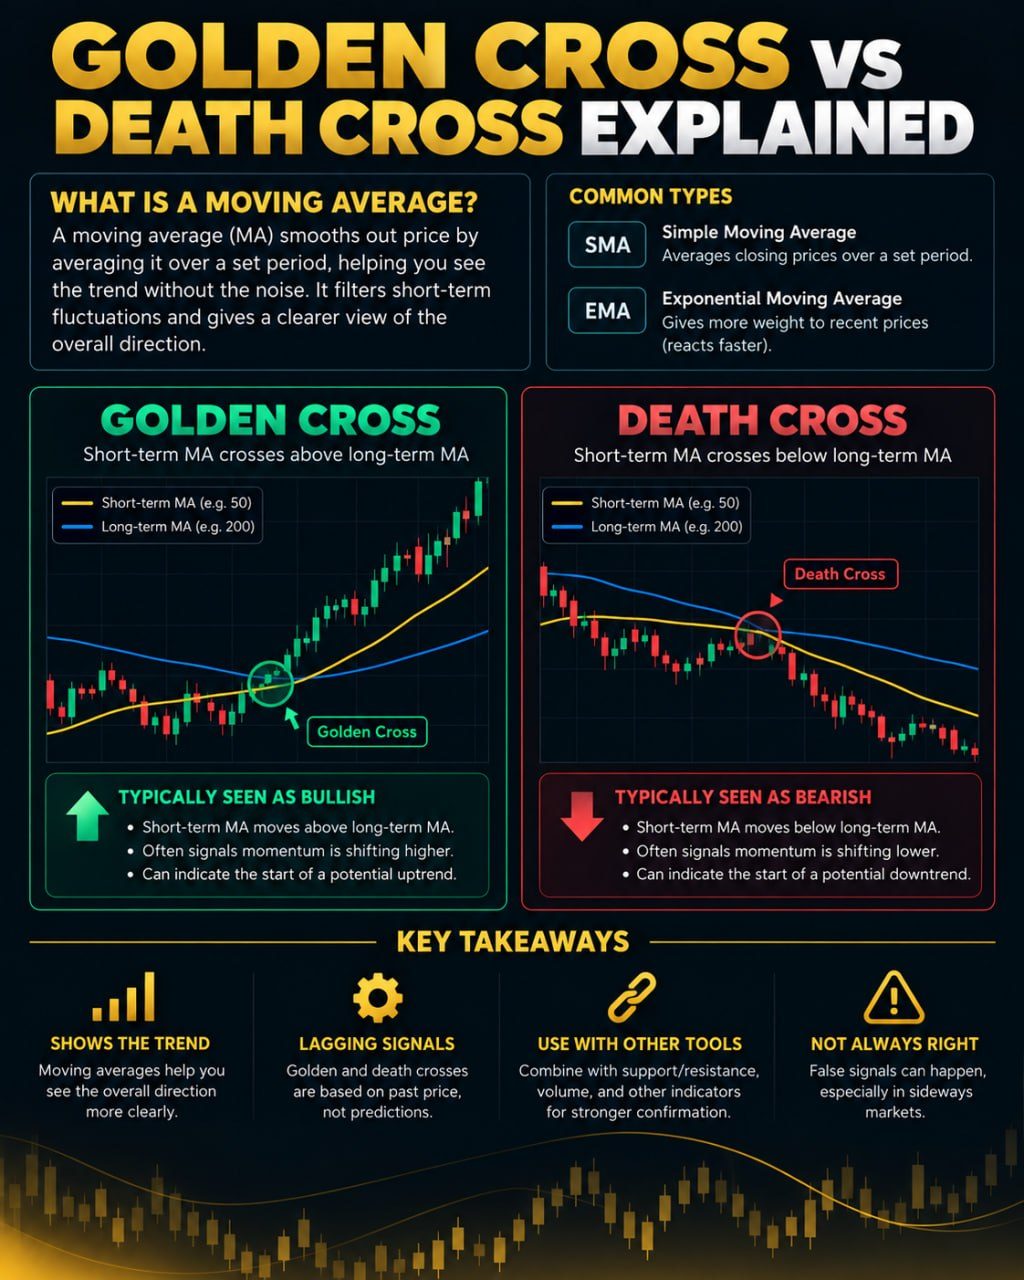
A moving average smooths out price by averaging it over a set period, helping you see the trend without the noise. A "golden cross" happens when a shorter-term moving average crosses above a longer-term one, often read as a sign momentum is shifting bullish. A "death cross" is the opposite: the shorter-term average crosses below the longer-term one, hinting at bearish momentum. These are lagging signals based on past price, not predictions, so traders usually pair them with other tools rather than relying on them alone.
What A Moving Average Actually Shows
A moving average takes a set number of past price points, usually closing prices, and averages them into a single line. As new price data comes in, the oldest data drops off and the average recalculates, so the line "moves" along with the chart. A 50-period moving average, for example, averages the last 50 candles of price data, whether those candles represent hours, days, or weeks depends on the chart's timeframe.
The purpose is to filter out the constant zig-zag of price so a trader can see the broader direction more clearly. A shorter moving average, like one covering 10 or 20 periods, reacts quickly to recent price changes. A longer one, like 100 or 200 periods, moves more slowly and reflects a more stable, longer-term view. Comparing how these two speeds interact is where crosses come in.
How A Golden Cross Forms
A golden cross occurs when a shorter-term moving average moves from below a longer-term moving average to above it. Imagine a coin trading around 100, where its 20-period average has been under its 100-period average for a while. If recent prices push up enough that the 20-period average climbs and crosses above the 100-period average, that crossing point is the golden cross.
Traders often interpret this as a signal that recent momentum has turned upward strongly enough to outpace the longer-term trend, and some read it as an early sign of a broader shift toward an uptrend. It does not mean price will keep rising, only that the recent average has overtaken the older average.
How A Death Cross Forms
A death cross is the mirror image. It happens when the shorter-term moving average crosses from above the longer-term moving average to below it. Using the same hypothetical coin, if price weakens enough that the 20-period average falls below the 100-period average, that crossing point is the death cross.
This is commonly read as a sign that short-term momentum has turned down relative to the longer trend, and some traders treat it as an early warning of a possible downtrend. As with the golden cross, it describes what already happened in the averages, not what will happen next.
Why These Signals Lag Reality
Moving averages are built entirely from past prices, so any cross is, by definition, a delayed reaction to price movement that already occurred. By the time a golden or death cross appears, a meaningful part of the move that caused it may already be over. This lag is the main limitation of the signal and why it works better as a description of trend character than as a precise timing tool.
Crosses can also produce false signals, especially when price is moving sideways rather than trending. In choppy conditions, the shorter and longer averages can cross back and forth repeatedly without any lasting directional move following, sometimes called whipsaw.
Using Crosses Alongside Other Tools
Because of the lag and false-signal risk, many traders use golden and death crosses as one input among several rather than a standalone trigger. They might combine it with volume, momentum indicators, support and resistance levels, or the overall market context to judge whether a cross is more likely to reflect a genuine shift or just noise.
Risk management matters regardless of what signal is used. Position sizing, stop-loss placement, and awareness that any single indicator can be wrong are part of using these tools responsibly. No moving average cross, or any other pattern, can guarantee future price direction, and treating it as a certainty rather than a probability is one of the most common mistakes traders make with this concept.