
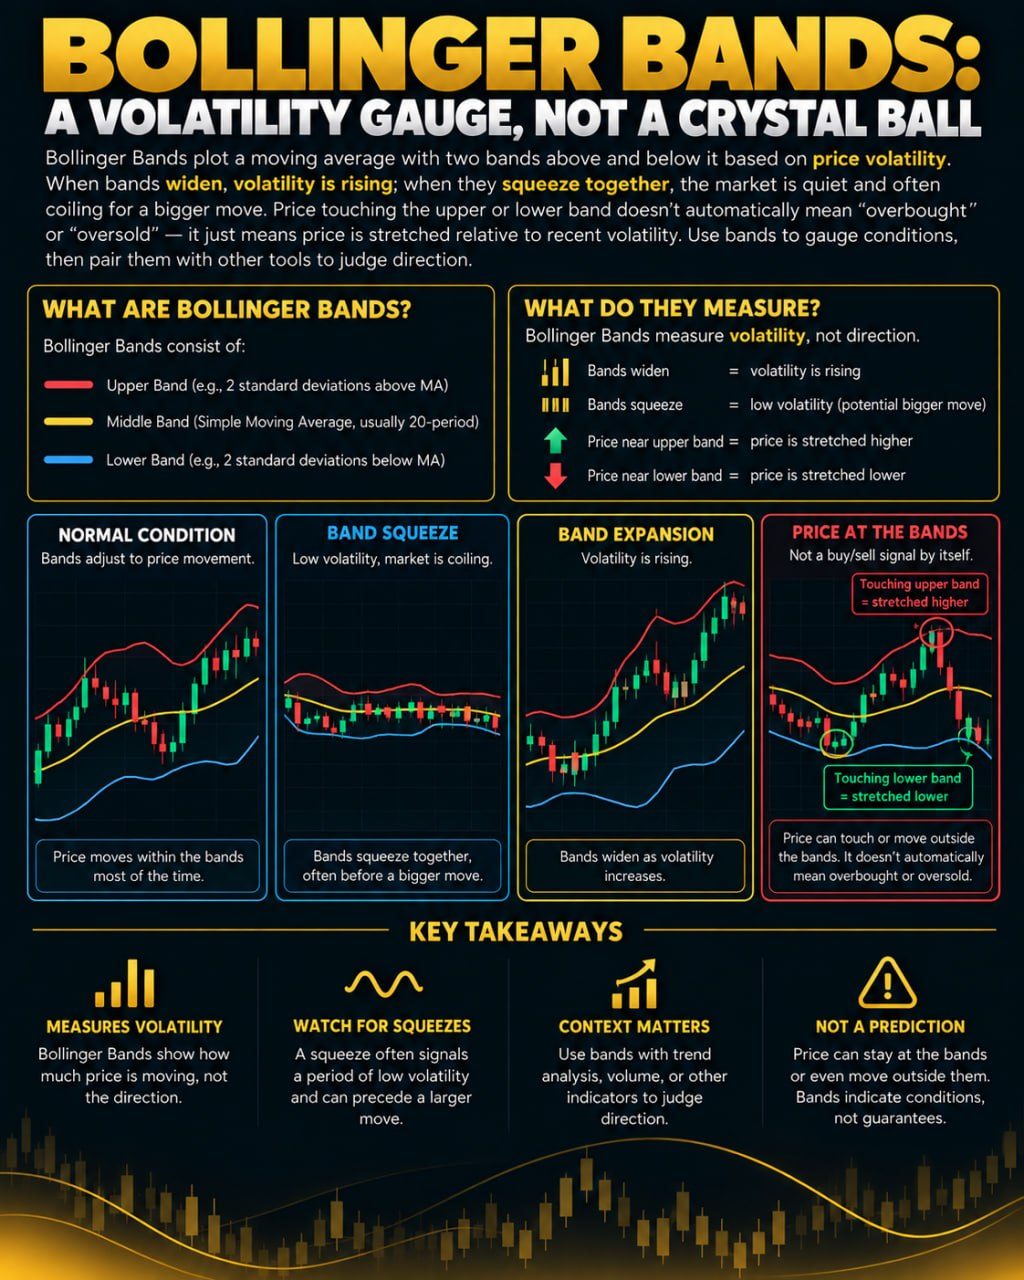
Bollinger Bands plot a moving average with two bands above and below it based on price volatility. When bands widen, volatility is rising; when they squeeze together, the market is quiet and often coiling for a bigger move. Price touching the upper or lower band doesn't automatically mean "overbought" or "oversold" — it just means price is stretched relative to recent volatility. Use bands to gauge conditions, then pair them with other tools to judge direction.
What Bollinger Bands Actually Are
Bollinger Bands are three lines drawn on a price chart. The middle line is a moving average, which is simply the average price over a set number of past candles, recalculated as new data comes in. The upper and lower lines are placed a certain distance above and below that average, and that distance is based on standard deviation, a statistical measure of how spread out recent prices have been from their average. In plain terms, standard deviation is just a way of measuring how "jumpy" or "calm" price has been lately.
Because the bands are built from recent volatility rather than a fixed number of points, they expand and contract on their own as market conditions change. This adaptive quality is the entire point of the tool. A tight range in a calm market looks very different from a tight range in a wild one, and Bollinger Bands adjust to reflect that difference automatically.
How the Bands Form and Move
When price starts swinging harder in either direction, the standard deviation increases, so the bands push farther apart. This widening is often described as the bands "opening up," and it usually coincides with periods of stronger trending moves or sharp reversals. Conversely, when price trades in a narrow range for a while, the standard deviation shrinks and the bands squeeze close together, a pattern often called a "squeeze."
A squeeze doesn't tell you which direction the next move will be, only that volatility is unusually low and has historically often preceded a pickup in activity. Markets don't stay quiet forever, so many traders watch for squeezes as a sign that a bigger move may be building, without assuming they know which way it will break.
Reading Price Against the Bands
A common misconception is that price touching the upper band means an asset is "overbought" and due to fall, while touching the lower band means "oversold" and due to rise. This isn't quite right. Touching a band simply means price has moved further from its average than it typically does, given recent volatility. In a strong uptrend, price can ride along the upper band for an extended period, and in a strong downtrend it can hug the lower band the same way. Treating a band touch as an automatic reversal signal has led many traders to fight strong trends and get run over.
A more balanced way to read the bands is as a stretch gauge. Price near a band suggests it is statistically extended relative to its recent behavior, which can mean a pause or pullback is more likely, but it is not a guarantee and can persist longer than expected.
Common Mistakes and Limitations
One frequent mistake is treating band touches as standalone entry or exit signals without any other confirmation. Another is ignoring the broader trend, since band behavior means something different in a trending market versus a sideways one. Bollinger Bands are also a lagging tool in the sense that the moving average and volatility measure are both based on past price data, so they describe recent conditions rather than predicting future ones.
No indicator, including this one, can guarantee outcomes, and settings that worked well in one period or on one asset may behave differently elsewhere.
Combining Bands With Other Tools
Because Bollinger Bands mainly describe volatility and relative price stretch, many traders pair them with tools that address direction or momentum, such as trend lines, volume analysis, or momentum oscillators, to build a fuller picture rather than relying on one signal alone.
Whatever combination of tools is used, sound risk management such as position sizing and predefined risk levels remains essential, since volatility can expand suddenly and markets can move against expectations at any time.