
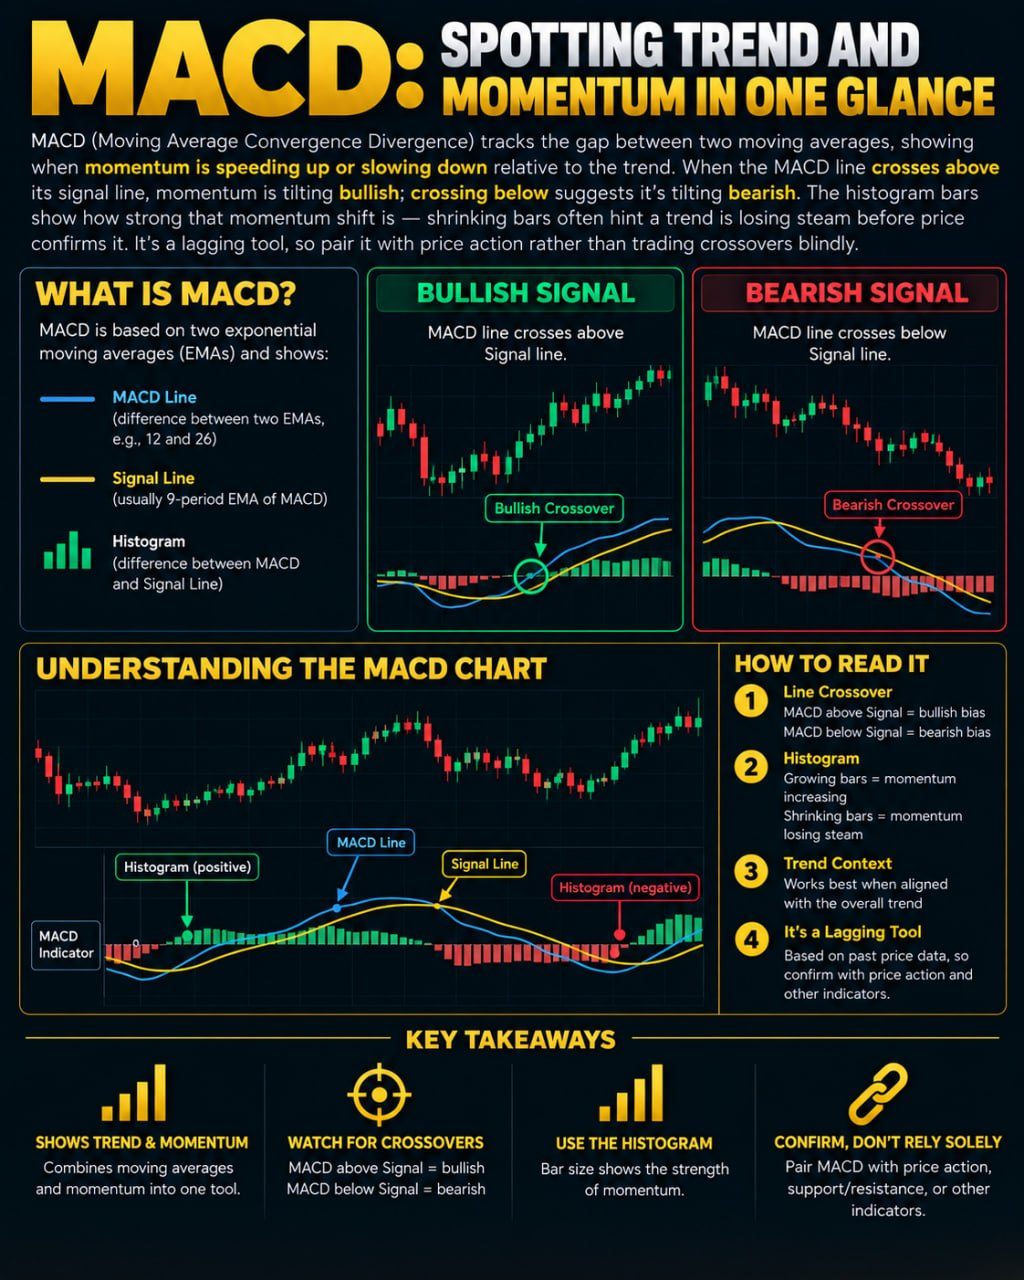
MACD tracks the gap between two moving averages, showing when momentum is speeding up or slowing down relative to the trend. When the MACD line crosses above its signal line, momentum is tilting bullish; crossing below suggests it's tilting bearish. The histogram bars show how strong that momentum shift is — shrinking bars often hint a trend is losing steam before price confirms it. It's a lagging tool, so pair it with price action rather than trading crossovers blindly.
What MACD Actually Measures
MACD stands for Moving Average Convergence Divergence. At its core it is a way of comparing two moving averages, which are simply lines that smooth out price by averaging it over a chosen number of periods. A moving average helps traders see the general direction of price without getting distracted by every small wiggle. MACD takes a faster moving average, meaning one built from fewer periods and more reactive to recent price, and subtracts from it a slower moving average built from more periods. The result is the MACD line, which oscillates around a zero point. When the faster average is above the slower one, the MACD line sits above zero, hinting that recent momentum is stronger than the longer term trend. When it dips below zero, the opposite is true.
The Signal Line and Crossovers
To make the MACD line easier to interpret, a second line called the signal line is added. This is usually a moving average of the MACD line itself, smoothing it further. Traders watch for the MACD line crossing above the signal line, which is often read as momentum turning more bullish, meaning buying pressure may be building relative to selling pressure. A cross below the signal line is read the opposite way, as momentum possibly turning bearish. These crossovers are the most commonly cited MACD signal, but a crossover by itself only says that recent momentum shifted relative to its own recent average, not that price is guaranteed to move in that direction.
Reading the Histogram
The histogram is a set of bars plotted around zero that represent the distance between the MACD line and the signal line. When the bars grow taller, the gap between the two lines is widening, suggesting momentum is accelerating in whatever direction the bars point. When the bars start shrinking even while price is still climbing or falling, it can suggest that the move is losing steam, since the two lines are converging again. This shrinking pattern is sometimes called divergence when it happens alongside price making a new high or low that the histogram does not confirm. It is worth noting divergence is a hint, not a rule, and can persist or fail without any reversal actually happening.
Why MACD Lags and What That Means
Because MACD is built entirely from moving averages, and moving averages are calculated from past price, MACD is inherently a lagging tool. It tells you what momentum has been doing, not what it will do next. A crossover can happen well after a meaningful part of a move has already occurred, and in choppy or sideways markets MACD can generate multiple crossovers that go nowhere, sometimes called whipsaws. This is a limitation shared by most indicators derived from price history, and it is one reason relying on any single signal in isolation tends to be fragile.
Using MACD Alongside Other Tools
Many traders treat MACD as one piece of a broader picture rather than a standalone trigger. Combining it with plain price action, such as support and resistance levels or candlestick behavior, and with volume, can help filter out weaker signals. Some also adjust the moving average lengths MACD is built from to suit different timeframes, though shorter settings tend to react faster but produce more noise, while longer settings are smoother but slower to respond.
Risk Management Still Matters Most
No indicator, including MACD, can guarantee an outcome, and past patterns do not assure future results. Traders who use MACD typically still define how much they are willing to risk on a position beforehand, size trades accordingly, and treat any signal as probabilistic rather than certain. Understanding MACD's mechanics helps interpret what it is actually telling you, which is far more useful than memorizing a rule like buy on cross, sell on cross without context.