
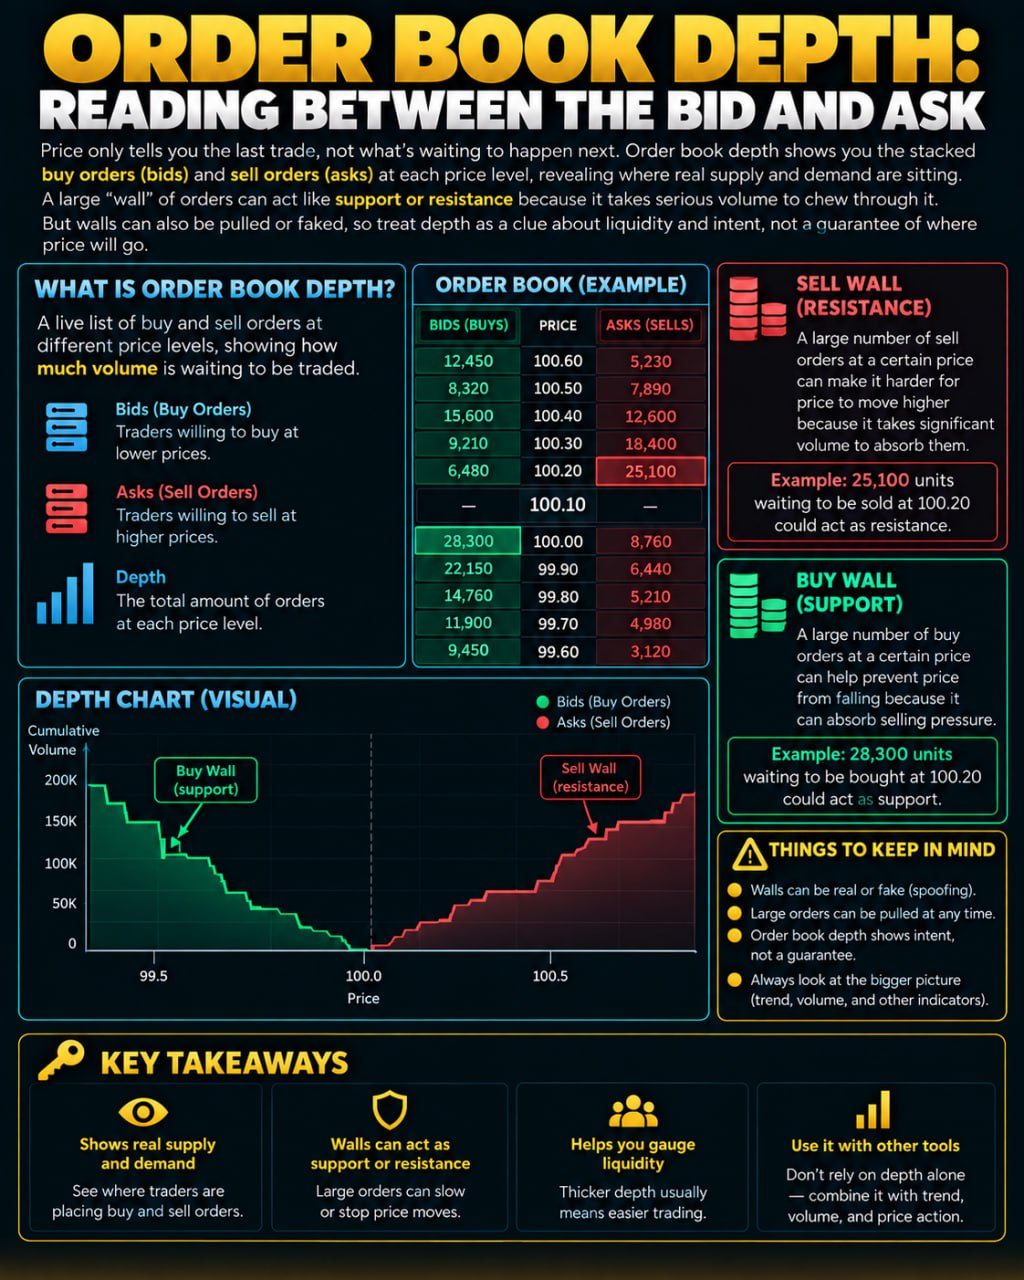
Price only tells you the last trade, not what's waiting to happen next. Order book depth shows you the stacked buy orders (bids) and sell orders (asks) at each price level, revealing where real supply and demand are sitting. A large "wall" of orders can act like support or resistance because it takes serious volume to chew through it. But walls can also be pulled or faked, so treat depth as a clue about liquidity and intent, not a guarantee of where price will go.
What The Order Book Actually Shows
Every trading venue that lists a market keeps a running list of orders that people have placed but that have not yet been matched with a trade. On one side sit the bids, the prices buyers are willing to pay right now. On the other side sit the asks, sometimes called offers, the prices sellers want. The order book stacks these by price level, so you can see not just the best bid and best ask but everything queued behind them. Order book depth simply means how much volume is waiting at each of those levels, close to the current price and further away.
This is different from a price chart, which only tells you what already happened. Depth tells you what could happen next if enough buying or selling pressure shows up. A market can look calm on the chart while the book underneath is thin, meaning even a modest order could move price a lot, or thick, meaning it would take a large order to move price at all.
How Walls Form And Why They Matter
When a large amount of size sits at one price level, traders often call it a wall. A big ask wall above the current price means a seller, or several sellers together, is willing to sell a lot at that level, which can slow or stop price from rising past it until that supply is absorbed. A big bid wall below current price works the other way, offering a cushion of demand that buyers can lean on.
Traders read these walls as rough proxies for support and resistance, concepts that describe price levels where an asset has tended to pause or reverse. The logic is simple, it takes real volume to trade through a wall, so the wall represents friction. That friction can slow a move even if it does not stop it outright.
Why Depth Can Mislead You
The order book is not a fixed structure, it is a live snapshot that changes constantly. A wall can be pulled seconds after you see it, because the person behind it never intended to actually get filled, they wanted to influence how other traders perceive the market. This tactic, sometimes called spoofing, means a wall can vanish the moment price gets close to it, letting the original order flip and trade in the opposite direction from what the wall implied.
Depth also only shows visible orders. Some participants use hidden or iceberg orders that reveal only a small portion of their true size at a time, so what you see in the book may understate real supply or demand. And depth on one venue does not capture what is happening on others, so a wall that looks decisive in one book might mean little in the broader market.
Using Depth Alongside Other Tools
Because of these limitations, most experienced traders treat order book depth as one input among several rather than a standalone signal. Combining it with volume trends, price action, and broader market context gives a fuller picture than depth alone. Depth tends to be most useful for very short term decisions, like gauging how much slippage a large order might cause, rather than for predicting where price will end up over days or weeks.
Risk Management Still Comes First
No matter how convincing a wall looks, it is not a guarantee. Walls get pulled, hidden orders exist, and liquidity can dry up in moments of stress. Treat depth as a way to understand liquidity and possible short term friction, not as a forecast. Position sizing, stop losses, and a clear plan for being wrong matter far more to long term outcomes than correctly reading any single order book snapshot.