
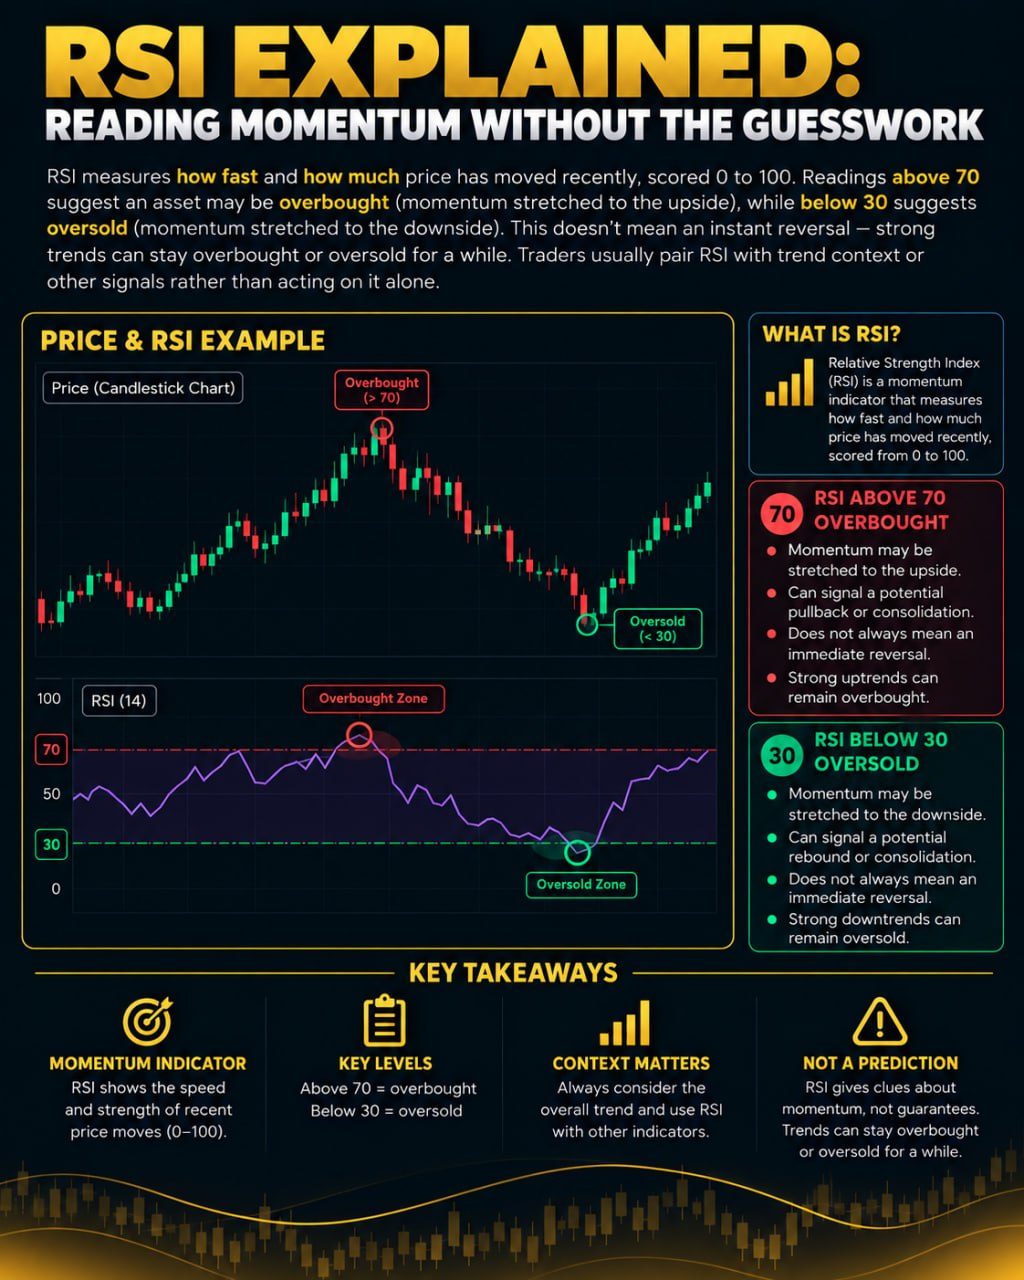
RSI measures how fast and how much price has moved recently, scored 0 to 100. Readings above 70 suggest an asset may be overbought (momentum stretched to the upside), while below 30 suggests oversold (momentum stretched to the downside). This doesn't mean an instant reversal — strong trends can stay overbought or oversold for a while. Traders usually pair RSI with trend context or other signals rather than acting on it alone.
What RSI Actually Measures
The Relative Strength Index, or RSI, is a momentum indicator. Momentum, in trading terms, just means the speed and strength of recent price moves rather than the price level itself. RSI takes the average size of recent gains and compares it to the average size of recent losses over a chosen period, commonly 14 candles or bars, then converts that comparison into a single number between 0 and 100.
The math itself is less important than the intuition. If price has been climbing steadily with few and small pullbacks, RSI rises toward the upper end of its range. If price has been falling hard with few bounces, RSI drops toward the lower end. A reading near 50 usually means gains and losses have been roughly balanced recently, suggesting no strong directional push either way.
Overbought and Oversold Zones
Traders typically watch two zones on the RSI scale. Above 70 is often labeled overbought, meaning upward momentum has been strong and stretched. Below 30 is often labeled oversold, meaning downward momentum has been strong and stretched. These labels describe the recent pace of movement, not a judgment about whether the asset is fundamentally too expensive or too cheap.
It helps to imagine a coin that has risen from 100 to 130 over a short stretch with almost no red candles along the way. Its RSI would likely be high, flagging that the move has been fast and one-sided. That does not tell you what happens next, only that the recent push has been forceful.
Why Overbought Does Not Mean Reversal
A common beginner mistake is treating an overbought or oversold reading as an automatic signal to trade against the trend. In strong trends, RSI can stay pinned above 70 or below 30 for extended periods while price keeps moving in the same direction. Selling simply because RSI crossed 70, or buying simply because it crossed 30, can mean fighting a powerful trend repeatedly and taking unnecessary losses.
This is why many traders treat these zones as a prompt to pay closer attention rather than an instruction to act. The question becomes whether other evidence supports a slowdown or reversal, not whether the RSI number alone justifies a decision.
Divergence and Other Ways Traders Use It
Beyond the overbought and oversold zones, some traders watch for divergence, which is when price makes a new high or low but RSI does not confirm it with a matching move. For example, if price reaches a higher high while RSI reaches a lower high than its previous peak, some see this as a hint that upward momentum is fading even though price is still rising. Divergence is a clue worth noting, not a guaranteed signal, and it can persist or fail without warning.
RSI is also sometimes used to gauge whether a pullback within a larger trend has become stretched enough to be considered a normal pause rather than a trend change.
Combining RSI With Other Tools
Because RSI only reflects recent momentum, it works better alongside context like the broader trend direction, support and resistance levels, volume, or chart patterns, rather than in isolation. Momentum can stay stretched, reverse sharply, or fade slowly, and RSI alone cannot tell you which outcome is coming.
No indicator, including RSI, can predict future price movement with certainty. It is one lens among many, useful for organizing observations about momentum, but it should be paired with clear risk management such as position sizing and predefined exit plans rather than relied on as a standalone trading rule.