
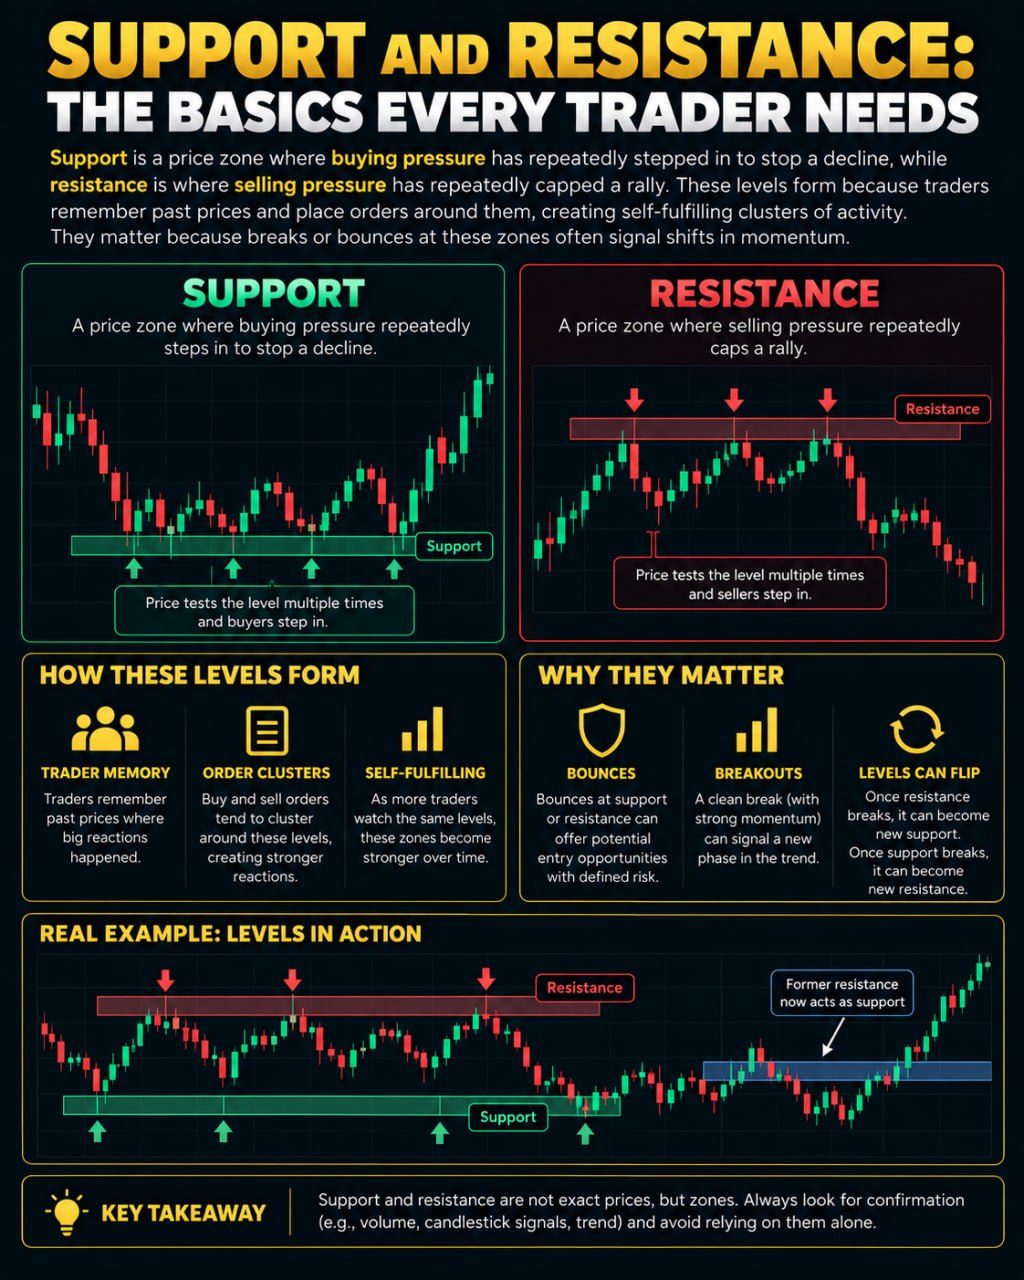
Support is a price zone where buying pressure has repeatedly stepped in to stop a decline, while resistance is where selling pressure has repeatedly capped a rally. These levels form because traders remember past prices and place orders around them, creating self-fulfilling clusters of activity. They matter because breaks or bounces at these zones often signal shifts in momentum. Note that once resistance breaks, it can flip into new support, and vice versa.
How These Zones Actually Form
Support and resistance are not exact lines drawn with a ruler, they are zones, because real markets rarely reverse at one precise number. A support zone is a price area where enough buyers have historically stepped in to slow or stop a decline, while a resistance zone is where enough sellers have historically shown up to cap a rally. These areas develop because market participants remember where price reacted before, and they place new orders around those same levels, whether that means buy orders near a prior low or sell orders near a prior high. Over time this shared memory becomes a kind of self-fulfilling behavior, since enough traders acting on the same idea can actually cause the price reaction they expected.
Reading Bounces and Breaks
Once a zone is identified, traders generally watch for one of two outcomes, a bounce or a break. A bounce happens when price approaches the zone and reverses, suggesting the zone is still respected by enough participants to shift momentum back the other way. A break happens when price pushes through the zone with enough force that it no longer holds, often accompanied by increased volume, which is simply the amount of trading activity happening at that time. Neither outcome is guaranteed in advance, and price can also stall, chop sideways, or fake a move before doing something else entirely. This is why many traders wait for a candle close beyond the zone, rather than a brief touch, before treating a break as meaningful.
The Flip Between Support and Resistance
A widely observed pattern is that once resistance is broken convincingly, it can become a new support zone, and once support is broken, it can become new resistance. Imagine a coin that struggled to rise above 100 several times, then finally pushes through. Traders often expect that if price later pulls back toward 100, buyers who missed the breakout may step in there, turning old resistance into new support. This flip is not automatic and does not always happen cleanly, but it is common enough that traders build it into how they mark future zones.
Common Mistakes and Real Limitations
A frequent mistake is treating support and resistance as exact prices rather than approximate zones, which leads to confusion when price reacts slightly above or below the expected level. Another is assuming a single touch of a level proves it is significant, when levels generally gain more weight the more times price has reacted to them. It is also easy to draw zones with hindsight bias, seeing clean patterns only after the fact, which is not the same as identifying them in real time. Importantly, no support or resistance zone guarantees future price behavior, since markets are influenced by many forces at once and any zone can fail without warning.
Using It Alongside Other Tools
Support and resistance work best as one part of a broader approach rather than a standalone signal. Many traders combine them with volume, trend direction, or other indicators to add context, since a level backed by rising volume on a bounce carries different weight than one on light activity. Risk management remains essential regardless of how convincing a zone looks, since predefining how much one is willing to risk before a trade helps limit losses when a level does not hold as expected. Ultimately these zones are tools for framing probabilities and structuring decisions, not certainties, and treating them otherwise is one of the more common errors newer traders make.