
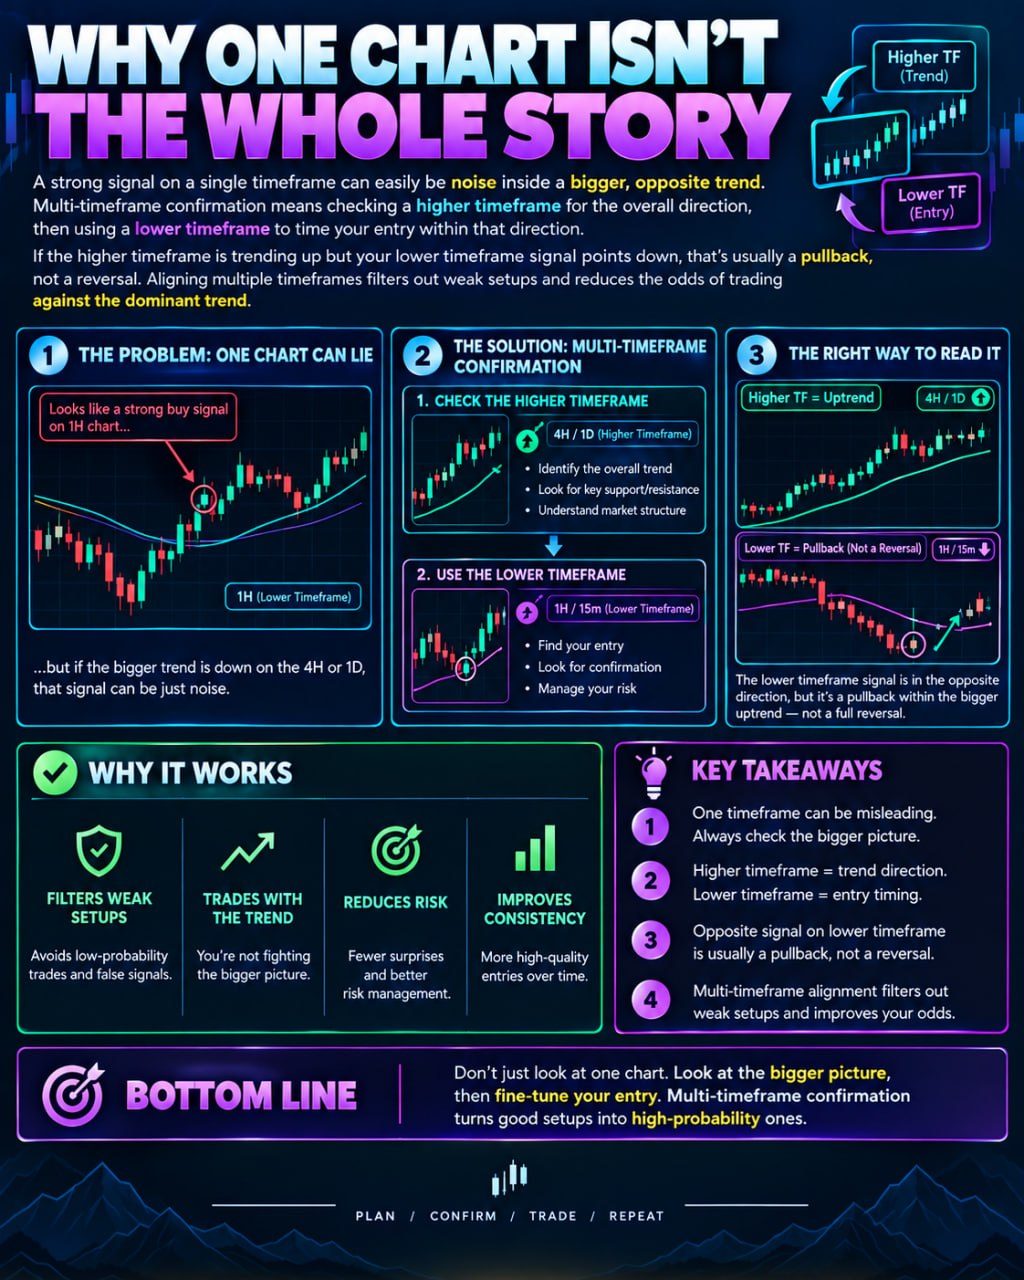
A strong signal on a single timeframe can easily be noise inside a bigger, opposite trend. Multi-timeframe confirmation means checking a higher timeframe for the overall direction, then using a lower timeframe to time your entry within that direction. If the higher timeframe is trending up but your lower timeframe signal points down, that's usually a pullback, not a reversal. Aligning multiple timeframes filters out weak setups and reduces the odds of trading against the dominant trend.
What Multi-Timeframe Analysis Actually Means
Every price chart you look at is really just one slice of time zoomed in or out. A 5-minute chart and a weekly chart can show the same asset behaving in almost opposite ways at the same moment, because they're measuring different rhythms of the same market. Multi-timeframe analysis simply means checking more than one of these slices before deciding that a signal is meaningful. A candlestick pattern, a moving average cross, or a breakout that looks convincing on a short timeframe might just be a ripple inside a much bigger wave that's moving the other direction entirely.
The core idea is to use a higher timeframe, like a daily or 4-hour chart, to understand the dominant trend, the general direction price has been moving over a longer stretch. Then you drop to a lower timeframe, like a 1-hour or 15-minute chart, to look for a more precise entry point that fits within that larger direction. The higher timeframe tells you which way the current is flowing, the lower timeframe helps you find a decent spot to get in without fighting that current.
How This Plays Out in Practice
Imagine a hypothetical coin that has been climbing steadily on the daily chart for weeks, a clear uptrend. If you zoom into the 15-minute chart, you'll almost certainly find moments where price dips, stalls, or even prints a bearish-looking pattern. Traders who only watch that lower timeframe might interpret the dip as a reversal signal and act on it in isolation. But viewed against the daily uptrend, that same dip often looks like a pullback, a temporary pause or retracement within a trend that is still intact.
This is the practical value of checking timeframes together. If the higher timeframe and lower timeframe agree, both suggesting the same direction, the setup is generally considered more reliable. If they disagree, that disagreement itself is useful information. It doesn't guarantee anything, but it flags that a signal may be low-quality noise rather than the start of something new.
Why Alignment Filters Out Weak Setups
Markets produce constant small signals on short timeframes simply because price never moves in a perfectly straight line. Most of these signals fade quickly and mean little in the bigger picture. By requiring some agreement between timeframes before considering an idea worth acting on, traders naturally filter out a large share of these low-value signals, since only a fraction of short-term patterns line up with the broader trend at any given moment.
Common Mistakes and Limitations
A common mistake is treating multi-timeframe confirmation as a guarantee rather than a filter. Trends can and do reverse, and a pullback can turn into an actual trend change without warning. Another mistake is checking timeframes that are too close together, like a 5-minute and a 15-minute chart, which tend to show very similar noise rather than genuinely different perspectives. It also becomes easy to cherry-pick whichever timeframe currently supports the trade you already want to take, which defeats the purpose of the exercise.
Fitting It Into a Broader Approach
Multi-timeframe analysis works best alongside other tools rather than alone, including trend indicators, support and resistance levels, and volume. It should also be paired with clear risk management, such as position sizing and stop-loss planning, since no combination of timeframes or indicators removes uncertainty from markets. It is one way to add context to a decision, not a method for predicting what price will do next.