
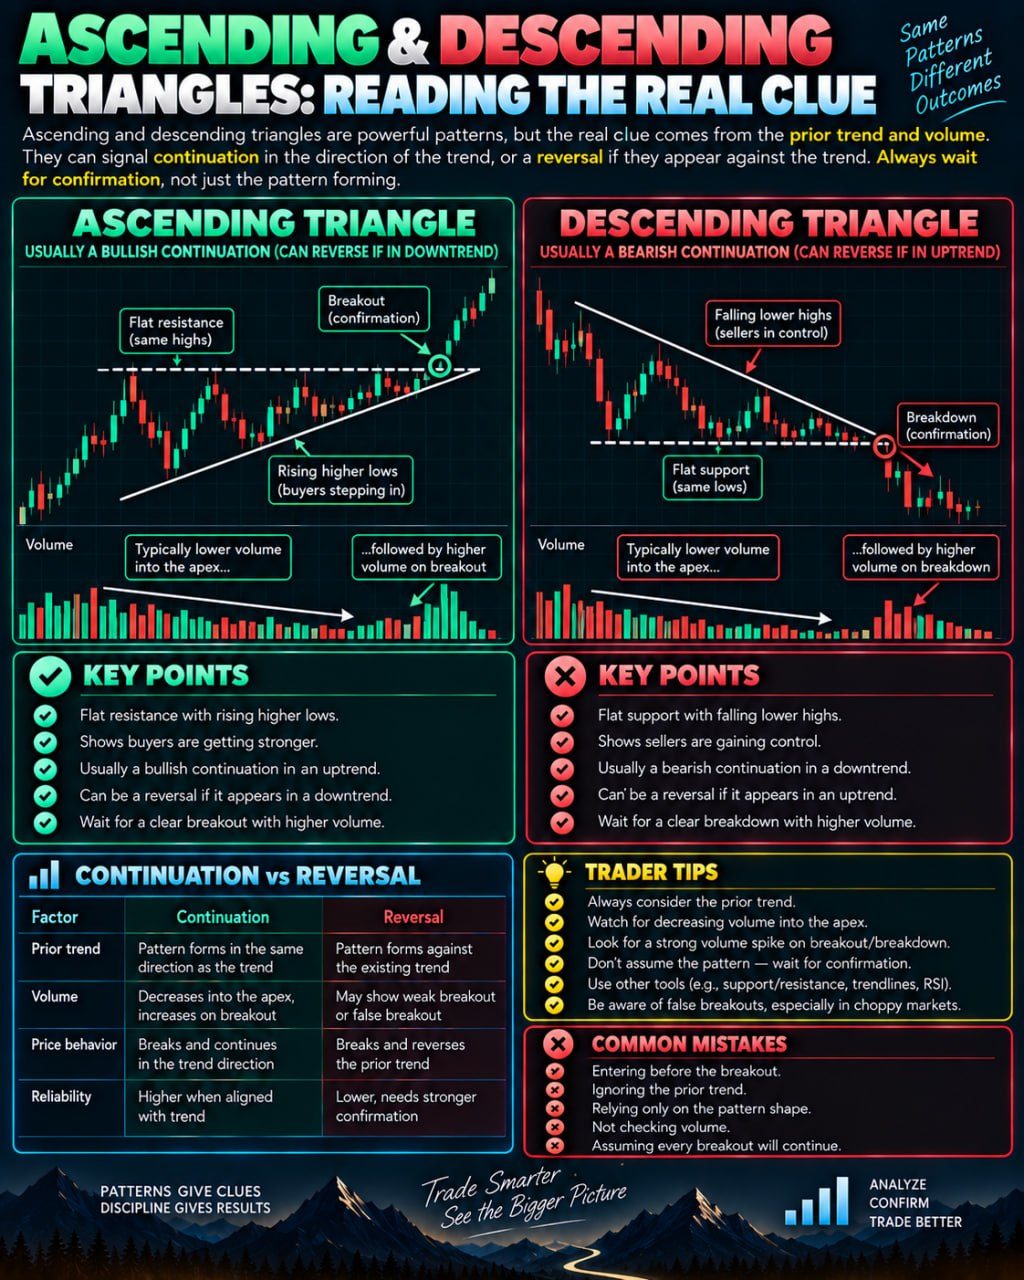
Ascending triangles form with a flat resistance line and rising higher lows, showing buyers stepping in more aggressively over time — usually a bullish continuation in an uptrend. Descending triangles mirror this with flat support and falling lower highs, hinting sellers are gaining control, often bearish in a downtrend. The real clue isn't the shape alone but the prior trend and volume: shrinking volume into the apex followed by a strong breakout confirms it, while a breakout against the prevailing trend can signal reversal instead. Always wait for confirmation, not just the pattern forming.
What These Triangles Actually Look Like
An ascending triangle forms when price keeps bumping into roughly the same resistance level, a ceiling it struggles to break, while the lows on each pullback get higher and higher. If you draw a line across the tops, it is roughly flat. If you draw a line under the bottoms, it slopes upward. That upward slope is the tell: buyers are willing to pay more each time, stepping in earlier before the price falls as far as it did before.
A descending triangle is the mirror image. Price keeps finding support at roughly the same floor, but each bounce off that floor is weaker than the last, so the highs slope downward while the lows stay flat. This suggests sellers are gradually gaining the upper hand, unloading at lower and lower prices rather than waiting for a bounce.
Why Trend Context Matters More Than Shape
A common beginner mistake is to spot the triangle shape and assume it automatically means one direction. In reality, these patterns are usually classified as continuation patterns, meaning they tend to resolve in the direction of the trend that existed before the pattern formed. An ascending triangle appearing after a sustained upward move is read as a pause where buyers are regrouping before potentially pushing higher. A descending triangle after a downward move suggests sellers pausing before potentially pushing lower.
When either triangle shows up in the opposite context, for example an ascending triangle at the end of a long downtrend, traders often treat it more cautiously, since it could be signaling an early reversal rather than a simple continuation. Shape without context tells you very little on its own.
Volume Is the Real Confirming Clue
The part of this pattern that gets overlooked is volume, the amount of trading activity behind the price moves. As price coils tighter and tighter toward the apex, the point where the two lines would eventually meet, volume typically shrinks. This makes sense: fewer traders are willing to commit while price is squeezed into a narrower range.
The meaningful signal is what happens next. A breakout accompanied by a clear jump in volume is generally treated as more credible, since it suggests real participation behind the move rather than a handful of trades pushing price through a thin level. A breakout on weak or unchanged volume is viewed far more skeptically and is more prone to failing or reversing shortly after.
Waiting for Confirmation Instead of Guessing
Because the lines only become a "triangle" in hindsight and because breakouts can be faked, many traders wait for the price to actually close beyond the flat line, rather than just poke through it, before treating the pattern as active. Some also want to see the price hold above or below that level for a bit rather than immediately snapping back inside the triangle, since false breakouts are common, especially in illiquid or highly volatile conditions.
Limitations and How It Fits With Risk Management
No chart pattern, including these two, guarantees a particular outcome. Triangles can fail, breakouts can reverse, and the same shape can appear in wildly different contexts with different results. They are best treated as one piece of evidence among several, alongside broader trend analysis, other indicators, and overall market conditions, rather than a standalone signal to act on.
Because of this uncertainty, position sizing, stop-loss placement, and awareness of how much capital is at risk matter more than correctly identifying the pattern itself. Even a textbook-looking triangle with a clean volume story can simply not work out, and planning for that possibility in advance is a core part of responsible trading.