
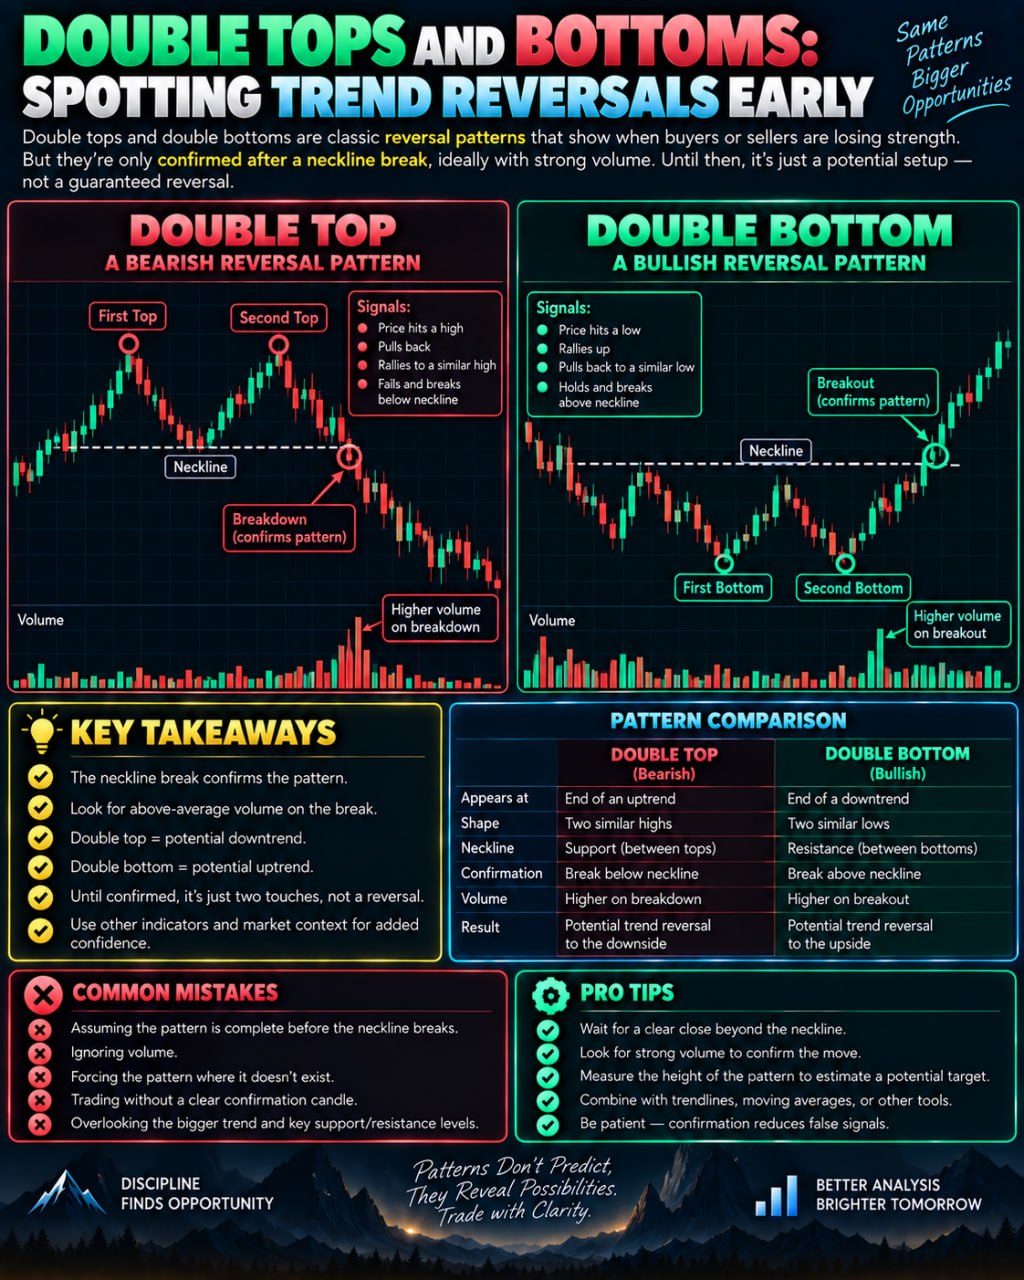
A double top forms when price hits a high, pulls back, rallies again to roughly the same high, then fails — signaling buyers are losing strength. A double bottom is the mirror image at lows, showing sellers running out of steam. Neither pattern is confirmed until price breaks the "neckline" — the low between the two tops, or the high between the two bottoms — ideally with above-average volume. Without that break, it's just two touches at the same level, not a reversal. Always wait for confirmation rather than assuming the pattern will play out.
What The Pattern Actually Shows
A double top is a price shape that appears after an uptrend. Price rallies to a high, pulls back some amount, then rallies again and gets stopped at roughly the same high a second time. The two peaks sit near the same level, with a dip in between, forming something that looks like the letter M on a chart. The idea behind it is simple: buyers pushed price up twice and failed to break through both times, which can suggest they are running out of fresh demand.
A double bottom is the mirror image, shaped like the letter W. Price falls to a low, bounces, falls again to roughly the same low, and then bounces a second time. Here the story is about sellers rather than buyers. Two failed attempts to push price lower can suggest that selling pressure is fading and buyers are starting to step back in.
The Neckline And Why Confirmation Matters
The point between the two peaks in a double top, or between the two troughs in a double bottom, is called the neckline. In a double top, the neckline is the low reached during the pullback between the two highs. In a double bottom, it is the high reached during the bounce between the two lows.
Until price actually breaks through that neckline, all you have is two touches at a similar level, not a confirmed reversal. Plenty of coins touch the same price twice and then simply continue in the original trend. Treating the pattern as decided before the neckline breaks is one of the most common mistakes traders make with this setup. Waiting for the close beyond the neckline, rather than reacting to the first wick or dip toward it, is generally considered a more cautious approach.
The Role Of Volume
Volume, meaning the amount of trading activity behind a price move, is often used as a secondary check. Many traders look for the break of the neckline to happen on above-average volume, since a break on very light activity is easier to reverse and may simply reflect a lack of participation rather than genuine conviction.
Volume analysis is not perfect and does not guarantee anything. It is best treated as one more piece of context rather than a trigger on its own.
How Traders Commonly Use It
Once a neckline break is confirmed, some traders use the height of the pattern, meaning the distance from the peaks or troughs to the neckline, as a rough guide for how far a move might extend afterward. This is only a general estimate drawn from the pattern's shape, not a prediction, and price frequently falls short of or overshoots such measurements.
Traders also commonly combine double tops and bottoms with other tools, such as trend lines, momentum indicators, or support and resistance levels, to see whether multiple signals line up rather than relying on one pattern alone.
Limitations And Risk Management
Double tops and bottoms can fail. Price can break the neckline briefly and then snap back, a situation often called a false breakout. The pattern can also look clean on one timeframe and messy on another, since a chart viewed hourly may show a double top while a daily chart shows something different entirely.
Because of this uncertainty, most traders think in terms of managing risk rather than expecting the pattern to work every time. That can include position sizing, using predefined exit points, and treating the pattern as one input among several rather than a certainty. No chart pattern, including this one, can reliably predict future price movement, and nothing here should be taken as a signal to enter or exit any position.