
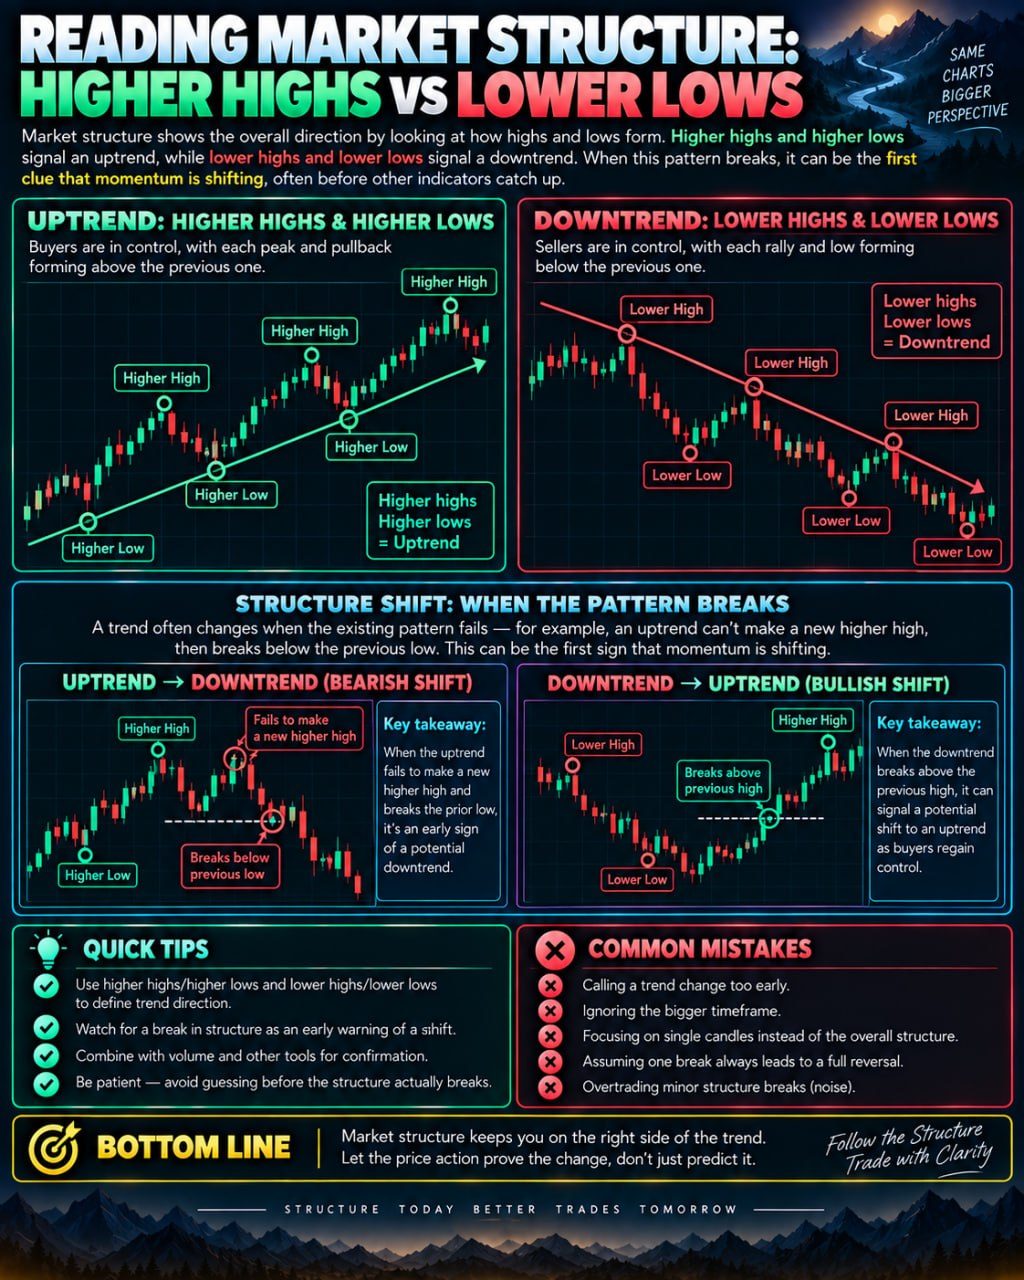
An uptrend is defined by higher highs and higher lows — each price peak and each pullback lands above the last one, showing buyers stepping in earlier each time. A downtrend flips this: lower highs and lower lows, meaning sellers keep capping rallies at weaker levels. A structure shift happens when this pattern breaks — like an uptrend failing to make a new higher high, then dropping below the prior low. That break is often the first clue momentum is changing before it shows up anywhere else.
What Market Structure Actually Means
Market structure is simply the shape that price leaves behind as it moves up and down over time. If you strip away every indicator and just look at a price chart, you still see a series of swings: price rises to a peak, pulls back to a low, rises again to another peak, pulls back again, and so on. Market structure is the study of how those peaks (highs) and troughs (lows) relate to each other. It is one of the oldest and most widely used ways traders try to describe what a market is doing without relying on any calculated indicator.
The reason this matters is that these swings tend to tell a story about who is in control, buyers or sellers, at any given moment. Reading that story well does not predict the future, but it gives a trader a common language for describing what has already happened and a framework for judging whether that behavior is continuing or changing.
Higher Highs and Higher Lows
An uptrend is generally described as a sequence of higher highs and higher lows. Imagine a coin that rallies from 100 to 120, pulls back to 110, then rallies again to 130, and pulls back to 115. Each peak is higher than the last peak, and each pullback low is higher than the last pullback low. This pattern suggests that buyers are willing to step in earlier on each dip, before price even returns to the previous low, which is often read as growing demand or confidence.
A downtrend is the mirror image: lower highs and lower lows. Each rally fails to reach the height of the last rally, and each decline pushes below the previous low. This suggests sellers are capping every bounce at a weaker level than before, and buyers are unable to defend the previous floor.
When Structure Breaks
A structure shift, sometimes called a break of structure, happens when this established pattern fails. In an uptrend, that might look like price failing to make a new higher high, then dropping below the most recent higher low. That combination, a failed high followed by a broken low, is often treated as an early signal that the balance of control may be shifting from buyers to sellers, even before any indicator confirms it.
The same logic works in reverse for downtrends. If a falling market fails to make a new lower low and then pushes back above the last lower high, some traders read that as an early sign the selling pressure is fading.
Using It Without Overusing It
Traders often combine structure reading with other tools rather than relying on it alone. Volume, support and resistance zones, or momentum indicators are commonly layered on top to see whether they agree with what the swing pattern is suggesting. Structure gives a shape, but these other tools help gauge the strength or conviction behind that shape.
Common Mistakes and Limits
A frequent mistake is treating every small wiggle as a meaningful swing high or low, which creates a noisy, contradictory structure that is hard to trust. Traders often deal with this by looking at multiple timeframes, since a break of structure on a very short timeframe can just be normal noise inside a much larger, unbroken trend on a higher timeframe.
It is also important to remember that a structure break is not a guarantee of a full trend reversal. Markets frequently fake out, breaking a prior low or high briefly before resuming the original trend. No pattern reading, including this one, removes the need for careful position sizing and predefined risk limits, since being wrong is always a possibility regardless of how clean the structure looks.