
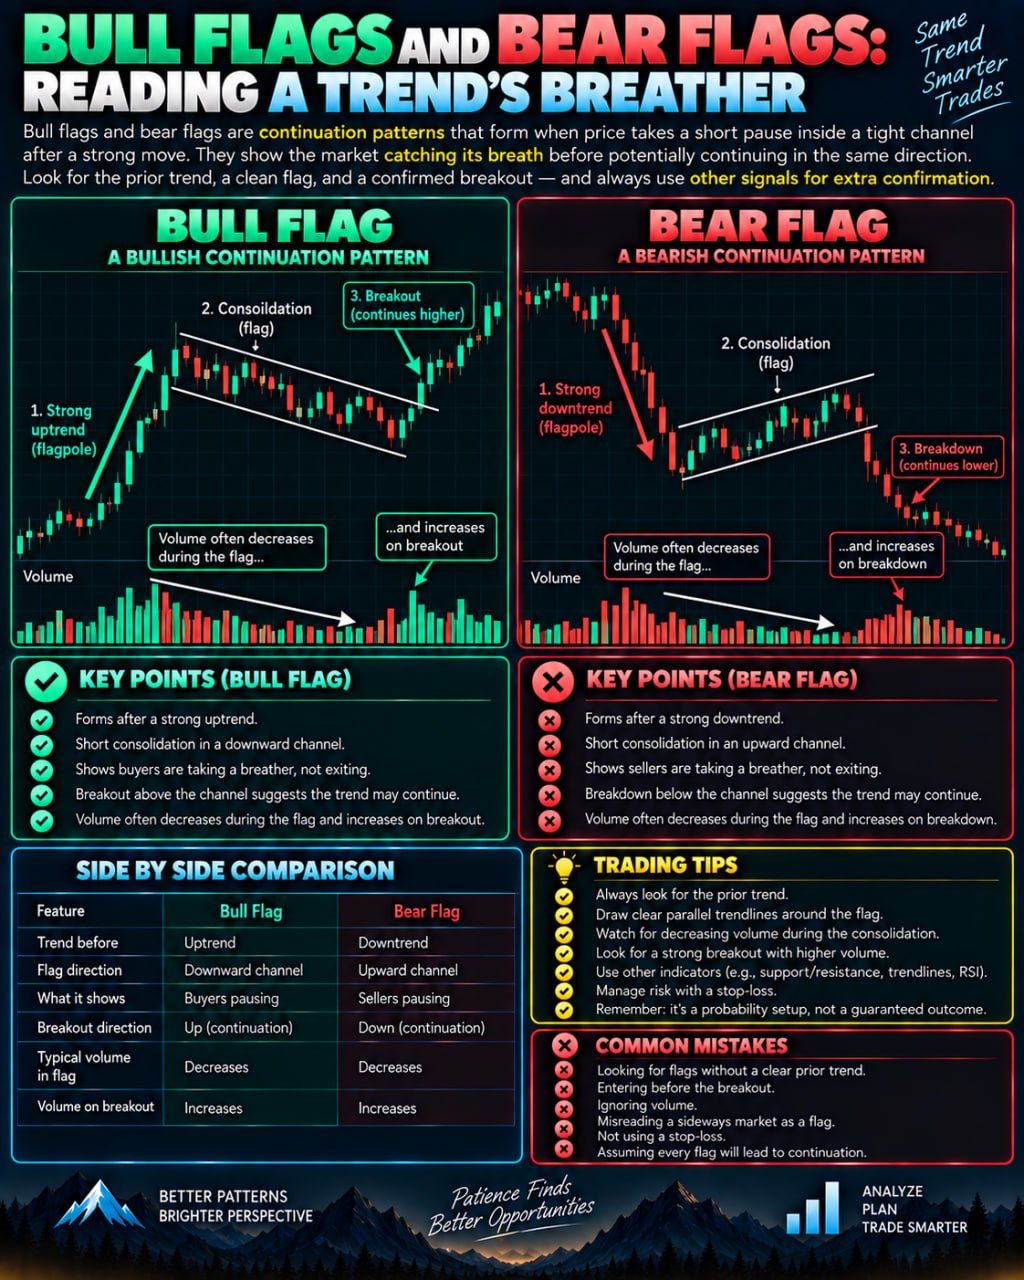
A flag forms when price makes a sharp move, then drifts sideways or slightly against that move in a tight, parallel channel — basically the market pausing to catch its breath. A bull flag dips or consolidates after a strong rally, and a bear flag rises or consolidates after a sharp drop; both suggest the prior trend may resume once price breaks out of the channel. Volume often fades during the flag and can pick up again on the breakout. It's a pattern to watch for context, not a guarantee — confirm with other signals before assuming the trend continues.
What a Flag Pattern Actually Looks Like
A flag pattern gets its name because it visually resembles a flag on a pole. The "pole" is a sharp, fast price move, either up or down, that happens over a short period. After that sudden move, price stops trending strongly and instead drifts sideways or gently against the pole's direction, forming a narrow, parallel-sided channel. That channel is the "flag" itself. When you look at a chart with this shape, it can seem like the market took a breath after sprinting, before deciding what to do next.
A bull flag appears after a strong rally. Instead of reversing hard, price eases into a shallow downward or sideways channel, holding most of its recent gains. A bear flag is the mirror image, appearing after a sharp decline, where price consolidates upward or sideways in a tight channel rather than falling further. In both cases the channel is usually much smaller in size and duration than the pole that preceded it.
Why Flags Tend to Form
After a fast move, some traders who bought or sold early start taking profit, while others who missed the initial move wait for a better entry point. This tug-of-war often produces a controlled, low-energy consolidation rather than a full reversal. Think of a hypothetical coin that jumps from 100 to 130 in a day, then spends the next few days drifting between 122 and 128. That sideways drift, if it stays contained in a narrow, parallel channel, is what traders would label a flag.
Volume often shrinks during this consolidation phase, reflecting reduced conviction or participation while the market digests the prior move. Many traders watch for volume to pick back up when price finally breaks out of the flag's channel, since renewed volume is sometimes read as a sign that the original trend has more energy behind it.
How Traders Read and Use Flags
The common idea behind flag patterns is that the pause is temporary, and the prior trend may resume once price breaks out of the channel in the same direction as the pole. For a bull flag, that would mean a breakout above the top of the consolidation channel. For a bear flag, it would mean a breakdown below the bottom of the channel. Some traders use the height of the pole as a rough way to think about how far a potential continuation might extend, though this is only a loose guideline, not a calculation with any guaranteed accuracy.
Because flags are short-term patterns, they are typically used on shorter timeframes or as one piece of a broader technical read, rather than as a standalone reason to act.
Common Mistakes and Limitations
One frequent mistake is labeling any sideways movement a flag, even when the channel isn't tight or parallel, or when the prior move wasn't genuinely sharp. Vague pattern recognition like this reduces whatever usefulness the pattern might have. Another mistake is assuming the breakout direction is guaranteed just because the pattern looks textbook. Flags can fail, price can break the wrong way, or it can simply chop sideways without resolving cleanly at all.
Flags also say nothing about the broader market environment, overall sentiment, or news that might override technical structure. A pattern forming during a period of low liquidity or unusual volatility may behave very differently than one forming under calmer conditions.
Fitting Flags Into a Wider Approach
Most experienced traders treat a flag as context rather than a signal on its own. It can be combined with volume analysis, support and resistance levels, or broader trend indicators to build a more complete picture. Risk management remains essential regardless of how convincing a pattern looks, since no chart formation removes the underlying uncertainty of markets. Position sizing, predefined risk limits, and acceptance that any setup can fail are what separate disciplined use of patterns like flags from simply hoping a shape on a chart repeats itself.