
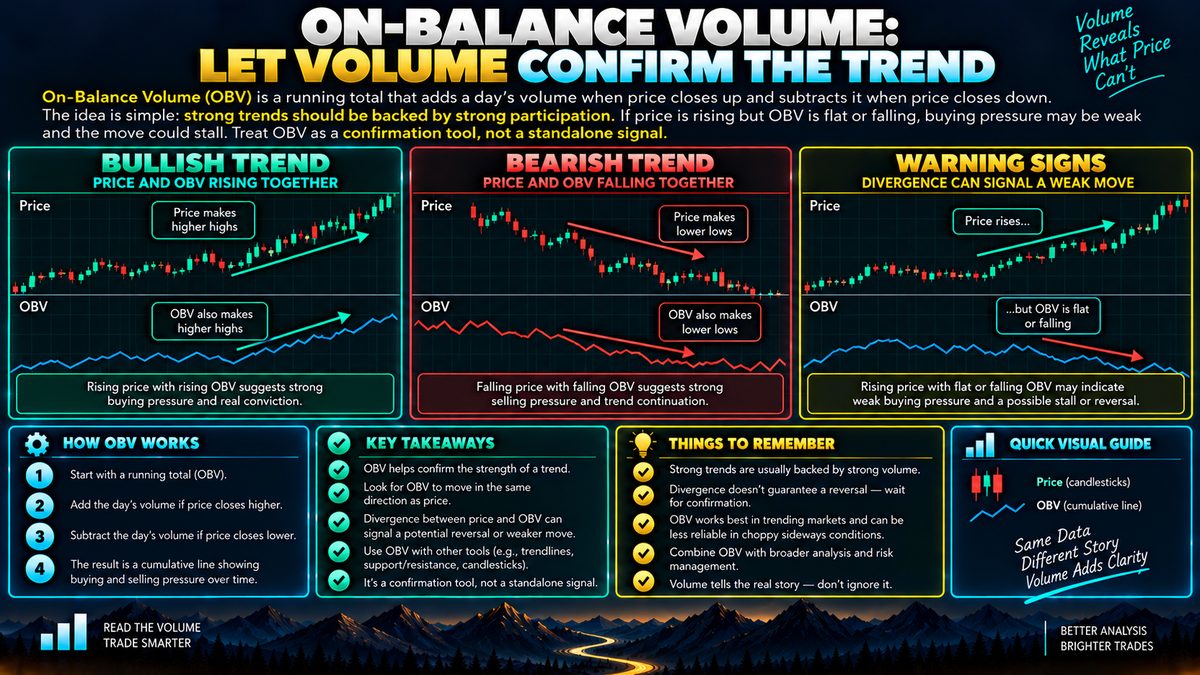
On-Balance Volume (OBV) is a running total that adds a day's volume when price closes up and subtracts it when price closes down. The idea is simple: strong trends should be backed by strong participation. If price is rising but OBV is flat or falling, buying pressure may be weak and the move could stall. If OBV climbs alongside price, it suggests real conviction behind the trend. Treat OBV as a confirmation tool, not a standalone signal.
What OBV Actually Measures
On-Balance Volume is built from a very simple rule. Take the trading volume for a period, usually a day or a candle on a chart, and look at whether the price closed higher or lower than the previous close. If it closed higher, that period's volume gets added to a running total. If it closed lower, that volume gets subtracted. If price closed unchanged, nothing changes. The result is a single line that climbs or falls over time, and its absolute value matters far less than its direction and shape.
The logic behind this is that volume represents participation, meaning how many units of the asset actually changed hands. Price alone tells you where the market ended up, but volume tells you how much conviction was behind that move. A trend built on heavy participation is considered more meaningful than one built on light activity, because more traders and more capital were involved in pushing it there.
How Traders Read the Line
The most common use of OBV is confirmation. If the price of an asset is making higher highs and OBV is also making higher highs, that alignment is read as a sign that buying pressure is genuine and the uptrend has support behind it. The same logic applies in reverse for downtrends with lower lows on both price and OBV.
Divergence is the other major reading. Imagine a coin trading at 100 that rises to 110 while OBV fails to rise with it, staying flat or even declining. This is called bearish divergence, and traders interpret it as a warning that the rally may be running on thinner participation than the price action suggests, which could mean the move is more fragile than it looks. The mirror image, where price is falling but OBV is flattening or rising, is called bullish divergence and is read as a possible sign that selling pressure is drying up.
Some traders also watch for OBV breaking a short-term high or low before price does, treating it as an early hint of a coming price move, since volume can sometimes shift before price fully reflects it.
Common Mistakes and Real Limitations
A frequent mistake is treating OBV as a precise, standalone timing tool. It is a cumulative running total, so its absolute level depends entirely on how far back the calculation started, which means the number itself has no fixed meaning. Only its slope and pattern relative to price are useful, not the raw figure.
Another limitation is that OBV treats every up or down close the same way regardless of how large the price move actually was. A tiny uptick and a large rally on the same volume are counted identically, which can distort the picture during choppy, low-conviction trading. OBV also depends on volume data being reliable and consistent, and thin or unevenly reported markets can produce misleading readings that do not reflect genuine participation.
Divergences can also persist for a long time without resolving, or can resolve in the opposite direction expected, so treating any single divergence as a guaranteed reversal signal is a mistake many beginners make.
Fitting OBV Into a Broader Approach
OBV works best as one input among several rather than a trigger on its own. Traders often pair it with trend lines, moving averages, or support and resistance levels to see whether volume is backing up what price structure is already suggesting. Because it is a lagging, derived measure, it should complement price action rather than replace it.
As with any indicator, position sizing and risk management matter more than the signal itself. No volume tool, including OBV, can guarantee how a market will behave next, and it should be treated as a piece of context rather than a forecast.