
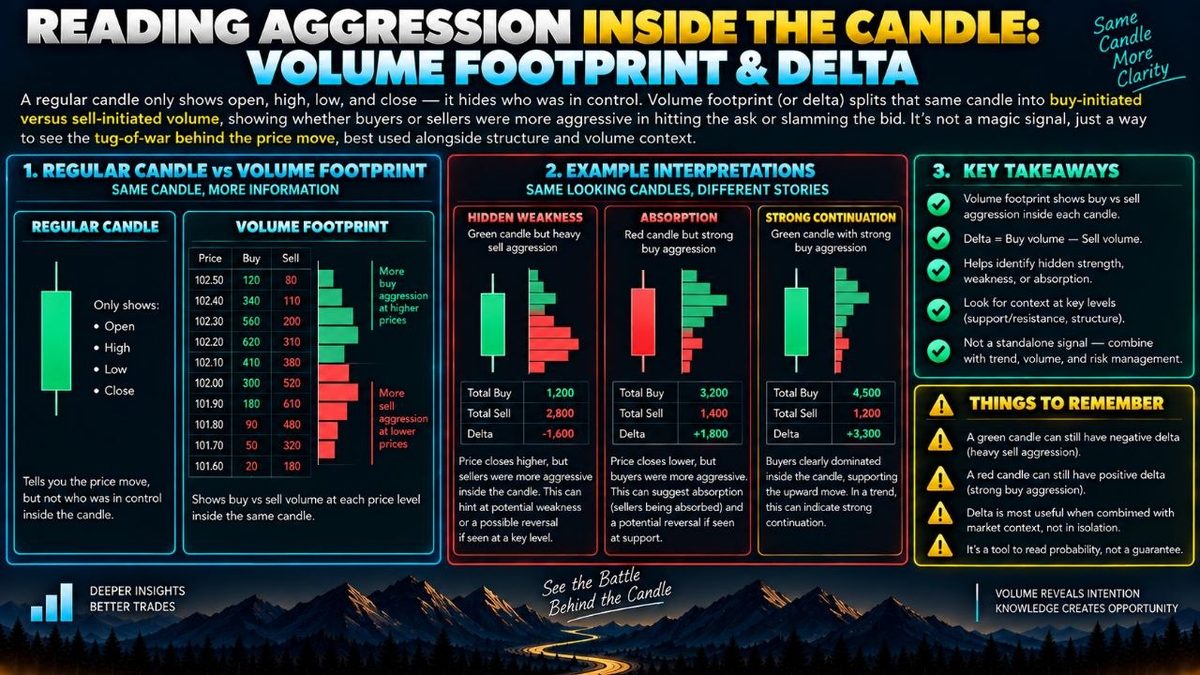
A regular candle only shows open, high, low, and close — it hides who was in control. Volume footprint (or delta) splits that same candle into buy-initiated versus sell-initiated volume, showing whether buyers or sellers were more aggressive in hitting the ask or slamming the bid. A candle that closes green but shows heavy sell aggression underneath can hint at hidden weakness, while a red candle with strong buy delta may show absorption. It's not a magic signal, just a way to see the tug-of-war behind the price move, best used alongside structure and volume context.
What A Regular Candle Hides
A standard candlestick tells you four numbers: where price opened, where it closed, and the highest and lowest points it touched during that period. That's useful, but it's also incomplete. Two candles can look identical on a chart, both green with the same size body and wicks, yet be built from completely different behavior underneath. One might have been driven by patient, steady buying, while the other was a violent tug-of-war where sellers actually dominated most of the period before a late push flipped the close positive. Ordinary candles cannot show you that difference. This is the gap that volume footprint and delta analysis tries to fill.
Breaking A Candle Into Buyers And Sellers
Every trade that happens has two sides, but exchanges typically tag each trade as either "buy-initiated" or "sell-initiated" depending on whether the trade happened by hitting the ask price (an aggressive buyer taking what sellers were offering) or hitting the bid price (an aggressive seller dumping into what buyers were willing to pay). A footprint chart takes a single candle and splits its total volume into these two categories at each price level traded during that candle. Delta is simply the difference between the two: buy volume minus sell volume. Positive delta means aggressive buying dominated that candle; negative delta means aggressive selling dominated, regardless of whether the candle's close ended up green or red.
Why The Mismatch Matters
The interesting cases are when the candle's color and its delta disagree. Imagine a candle that closes green, meaning price technically ended higher, but the footprint shows deeply negative delta, meaning sellers were far more aggressive throughout the period. This can suggest that buyers barely managed to nudge price up despite heavy selling pressure underneath, sometimes described as hidden weakness. The reverse is also watched closely: a red candle with strongly positive delta can mean buyers were aggressively stepping in and absorbing sell orders, even though price still drifted down. Traders sometimes call this absorption, where one side is soaking up the other side's aggression without giving up much ground.
How Traders Use This Information
Footprint and delta are generally used as a lens on conviction, not as a standalone trigger. A trader might look for delta divergence near a support or resistance level, using it to gauge whether a breakout looks genuinely committed or whether it looks fragile despite the price action. Others watch for delta to confirm a move already suggested by chart structure, treating agreement between price and delta as a sign of a cleaner, more decisive candle. None of this predicts what happens next; it only describes what already happened inside that bar.
Limits, Mistakes, And Context
The biggest mistake is treating footprint or delta as a magic buy or sell signal rather than a description of past aggression. Data quality also matters, since delta calculations depend on how a venue classifies trades, and thin or erratic markets can produce noisy, misleading readings. Reading a single candle in isolation is another common trap, since one bar rarely tells a full story on its own. Most experienced users combine footprint reading with broader volume context, overall market structure, and clear risk management, sizing positions conservatively and always acknowledging that any tool, including this one, can be wrong. It is best understood as one extra window into market behavior, not a substitute for a full trading plan.