
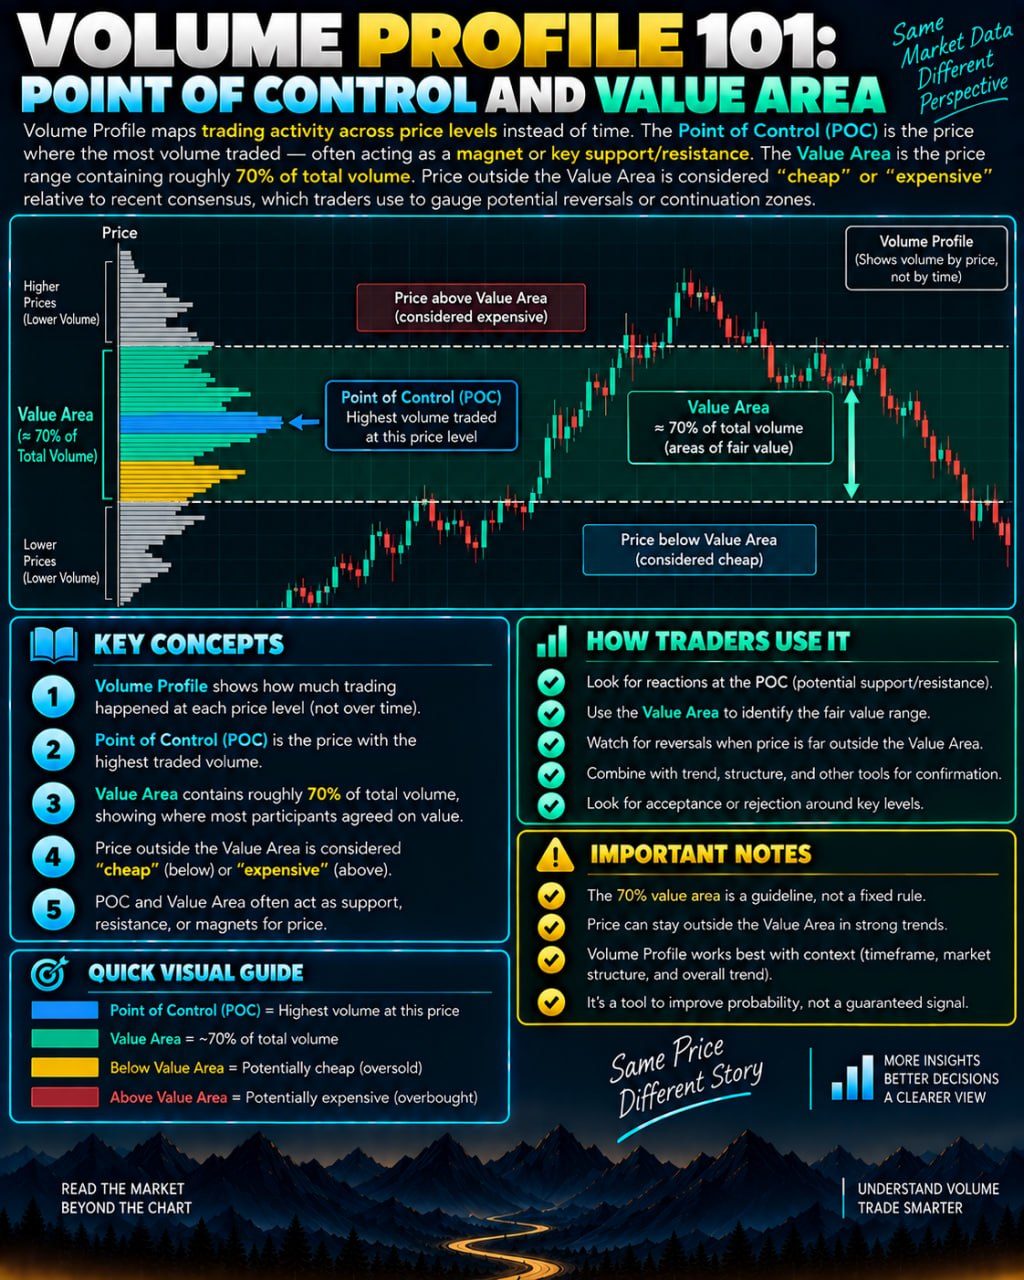
Volume Profile maps trading activity across price levels instead of time. The Point of Control (POC) is the price where the most volume traded — often acting as a magnet or key support/resistance. The Value Area is the price range containing roughly 70% of total volume, showing where most participants agreed on fair value. Price outside the Value Area is considered "cheap" or "expensive" relative to recent consensus, which traders use to gauge potential reversals or continuation zones.
What Volume Profile Actually Shows
Most charts you look at, like candlesticks or line charts, organize information by time. Each bar represents a fixed slice of time, such as an hour or a day, showing how price moved during that period. Volume Profile flips this around. Instead of asking "what happened during this hour," it asks "how much trading activity happened at this price." The result is usually displayed as a horizontal histogram sitting beside or on top of the price chart, with longer bars marking price levels where a lot of buying and selling occurred, and shorter bars marking levels that traded relatively lightly.
This matters because price and time alone do not tell you where the real battles between buyers and sellers took place. A coin could spend hours slowly drifting through a price zone with almost no volume, then explode in activity at another level entirely. Volume Profile makes that difference visible.
The Point of Control
The Point of Control, usually shortened to POC, is simply the single price level within the profile where the most volume traded over the period being analyzed. Because so many transactions cleared at that price, many traders view it as a level of temporary consensus, a spot where a large number of buyers and sellers agreed that the asset was fairly valued.
Because of this, the POC is often watched as a magnet. If price moves away from it, some traders expect a chance of drifting back toward it, since it represents an area of prior comfort. If price is trying to break through it, the heavy volume already transacted there can act like a wall, since many participants who traded at that level may react to price revisiting it. None of this is guaranteed. It is a tendency observed often enough that traders pay attention to it, not a rule that price obeys.
The Value Area
The Value Area is the price range that contains a defined share of total volume, commonly set around 70 percent, centered on the POC. Everything inside this band is considered the zone of recent fair value, where the bulk of participants transacted. Everything outside it, whether above or below, represents thinner trading, meaning fewer participants agreed that those prices were reasonable.
Traders sometimes describe price above the Value Area as relatively expensive and price below it as relatively cheap, purely in the sense of recent trading consensus, not in any judgment about long-term worth. When price pushes outside the Value Area and then quickly returns, some traders interpret that as a rejection of the offer or bid at that stretched price. When price stays outside and keeps building volume there, it can indicate that a new consensus is forming at different levels.
How Traders Use These Concepts
Common uses include watching whether price accepts or rejects a return to the POC, using the edges of the Value Area as reference points for potential support or resistance, and comparing where the current price sits relative to the recent profile to judge whether conditions look stretched or balanced. Some traders build profiles over different windows, such as a single session or several weeks, to compare short-term and longer-term consensus areas.
Limitations and Fitting It Into a Bigger Picture
Volume Profile describes the past, not the future, and shapes can shift quickly as new volume accumulates elsewhere. It also depends heavily on the time window chosen, so two traders looking at different periods can draw very different levels from the same asset. It works best combined with other tools such as trend structure, order flow, or basic risk management, including position sizing and stop losses, rather than as a standalone signal. No profile, POC, or Value Area guarantees where price will go next.