
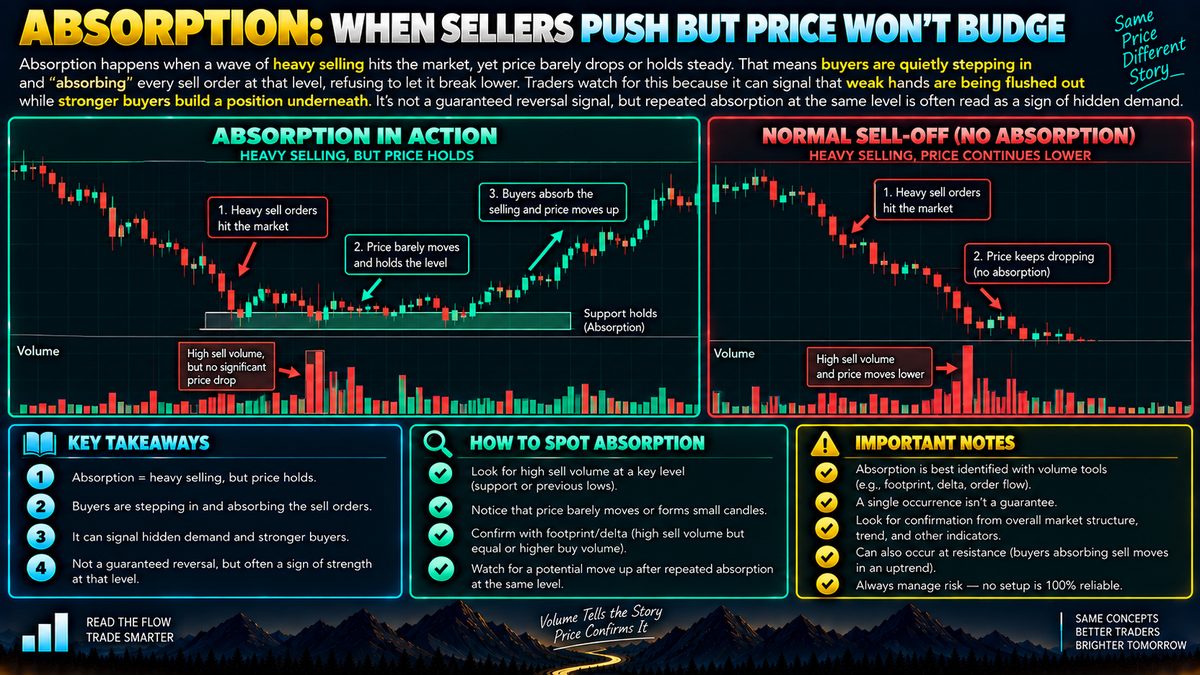
Absorption happens when a wave of heavy selling hits the market, yet price barely drops or holds steady. That means buyers are quietly stepping in and "absorbing" every sell order at that level, refusing to let it break lower. Traders watch for this because it can signal that weak hands are being flushed out while stronger buyers build a position underneath. It's not a guaranteed reversal signal, but repeated absorption at the same level is often read as a sign of hidden demand.
What Absorption Actually Is
Absorption describes a specific mismatch between effort and result in the market. Sellers are pushing hard, meaning a large number of sell orders are hitting the market, yet price does not fall the way you would expect given that pressure. Instead of sliding lower, price stalls, chops sideways, or only dips slightly before recovering. The "effort" is the volume of selling; the "result" is the price change. When effort is high but result is small, something on the other side of the trade is absorbing that supply.
In practical terms, this means buyers are willing to take every unit that sellers offer at that price without demanding a discount. Imagine a coin trading around 100 units of value, and a wave of sell orders large enough to normally push it down to 95 comes through. If price instead holds near 99 or 100, buyers have absorbed that selling. The order book at that level is acting like a sponge.
How Absorption Forms
Absorption typically shows up at a specific price level rather than across a wide range. This can happen near a previous low, a round number, or any zone where a lot of past trading activity occurred. Large buyers, sometimes called resting orders, sit at that level ready to purchase whatever is sold. As sellers hit the market, those buy orders get filled, but instead of disappearing after being used once, similar-sized buying keeps reappearing at the same spot.
Volume is the key ingredient traders look at. A drop in price on light volume is not particularly meaningful. But a flat or barely-moving price on unusually heavy volume is the signature of absorption. It suggests that despite a real fight between buyers and sellers, one side is refusing to give ground.
How Traders Read It
Traders who watch order flow, volume profiles, or footprint charts try to spot absorption in real time by comparing volume spikes to the resulting price move. When they see heavy selling volume paired with little to no downward movement, they treat it as a clue that demand might be stronger than it appears on the surface.
Some traders view repeated absorption at the same level, especially after multiple attempts by sellers to break it, as a sign that weaker holders are exiting while more committed buyers accumulate underneath. This is sometimes described as a shakeout, where nervous sellers give up their position right before conditions stabilize or improve. However, this interpretation is only ever a probability, never a certainty.
Common Mistakes and Limitations
A frequent mistake is assuming absorption automatically means a reversal is coming. Price can absorb selling for a while and then still break down later once the buying interest is exhausted. Absorption shows current battle conditions, not a promise about the future.
Another issue is that absorption is easier to see in hindsight than in the moment. Confirming it in real time requires access to detailed volume or order book data, which many casual traders do not have and can misread.
Fitting Absorption Into a Broader Approach
Absorption is best treated as one piece of context, not a standalone signal. Traders often combine it with support and resistance levels, trend analysis, or other volume tools before drawing conclusions. Because absorption does not guarantee direction, sensible risk management such as position sizing and stop losses remains essential regardless of how convincing the pattern looks.