
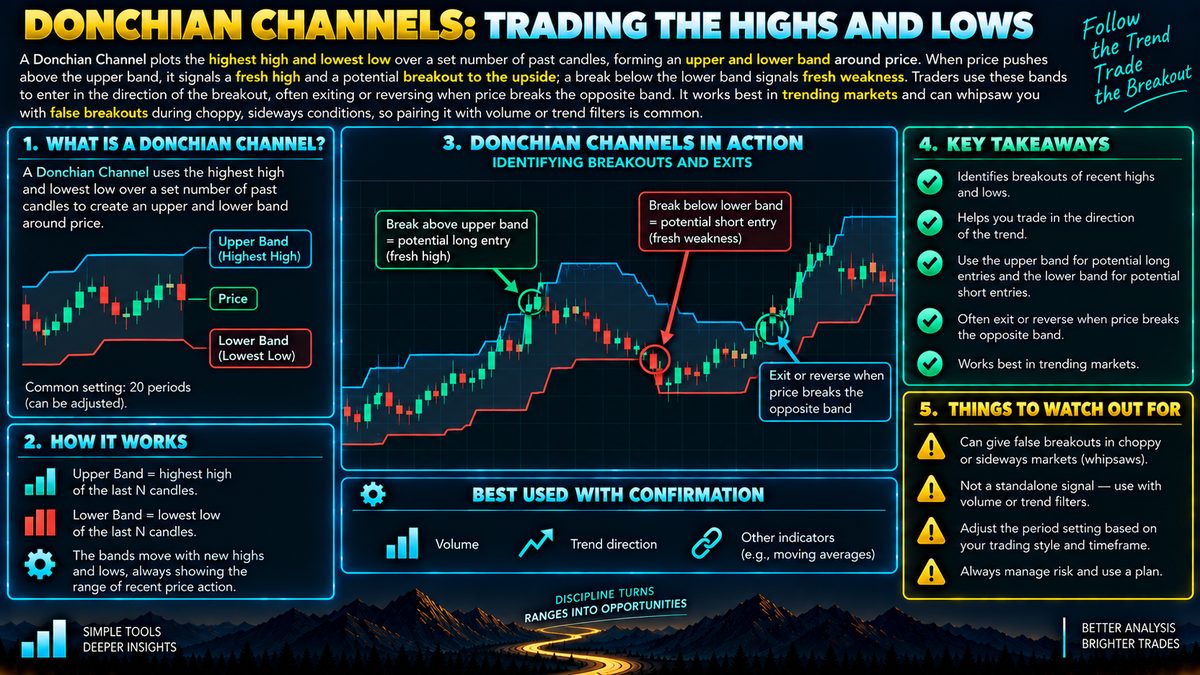
A Donchian Channel plots the highest high and lowest low over a set number of past candles, forming an upper and lower band around price. When price pushes above the upper band, it signals a fresh high and a potential breakout to the upside; a break below the lower band signals fresh weakness. Traders use these bands to enter in the direction of the breakout, often exiting or reversing when price breaks the opposite band. It works best in trending markets and can whipsaw you with false breakouts during choppy, sideways conditions, so pairing it with volume or trend filters is common.
What A Donchian Channel Actually Shows
A Donchian Channel is a simple chart tool built from just two numbers over a chosen lookback period, say the last 20 candles. The upper band marks the highest high reached during that window, and the lower band marks the lowest low. Between them, some charting tools also plot a middle line, which is just the average of the two, giving a rough sense of the range's center.
Unlike indicators that smooth price into a single line, Donchian Channels are pure price extremes. There's no averaging of closes, no complex formula, just "what's the highest and lowest price has been over this stretch of time." That simplicity is the whole point. It was originally developed for tracking commodity trends and later became popular with systematic futures traders, but the logic applies to any market with enough price history, including crypto.
How The Bands Form And Move
As new candles form, the channel updates. If price makes a new high, the upper band steps up to match it. If price stays quiet and doesn't set new highs or lows, the bands can flatten out, creating a narrower channel. During a strong directional move, the bands will trail behind price, widening as new extremes are set. During a quiet, sideways stretch, the channel tightens, because the highest high and lowest low aren't changing much.
This behavior means the channel's width itself carries information. A wide channel suggests recent volatility and a market that has been moving decisively. A narrow, tight channel suggests consolidation, a period where buyers and sellers are roughly balanced and price is drifting within a smaller range.
How Traders Read Breakouts
The core idea is straightforward: when price closes above the upper band, it's making a fresh high for that lookback period, which some traders interpret as a sign that buying pressure is strong enough to push into new territory. A close below the lower band suggests the opposite, that sellers are pushing price to fresh lows. Traders following this approach might enter a long position on an upside break and a short position on a downside break, treating the channel as a trend-following trigger rather than a prediction.
Exits are often handled the same way, in reverse. A common approach is to hold a long position until price breaks back below the lower band, or some shorter version of the same channel, treating that as a sign the trend has lost momentum. This turns the channel into a full system rather than just an entry signal.
Common Pitfalls And False Signals
The biggest weakness is choppy, range-bound markets. In these conditions, price can poke above the upper band, trigger a breakout entry, then quickly reverse and poke below the lower band shortly after. This back-and-forth, often called whipsaw, can generate a string of losing trades in a market that isn't actually trending anywhere. Because Donchian Channels only look at extremes, they have no built-in way to tell a genuine trend from a temporary spike.
Another limitation is that the bands are backward-looking by nature. They describe what has already happened, not what will happen next, and a breakout can just as easily fail as continue.
Combining It With Other Tools
Because of these limitations, many traders pair Donchian Channels with a trend filter, such as a longer moving average, to only take breakout signals in the direction of the broader trend. Others watch trading volume alongside the breakout, reasoning that a move on higher volume carries more conviction than one on thin activity. Some also use a shorter secondary channel for exits, distinct from the entry channel, to reduce the lag in closing losing trades.
As with any tool, position sizing and stop-loss placement matter more than the signal itself. No channel, indicator, or pattern guarantees an outcome, and Donchian Channels work best as one input within a broader, risk-managed approach rather than a standalone system.