
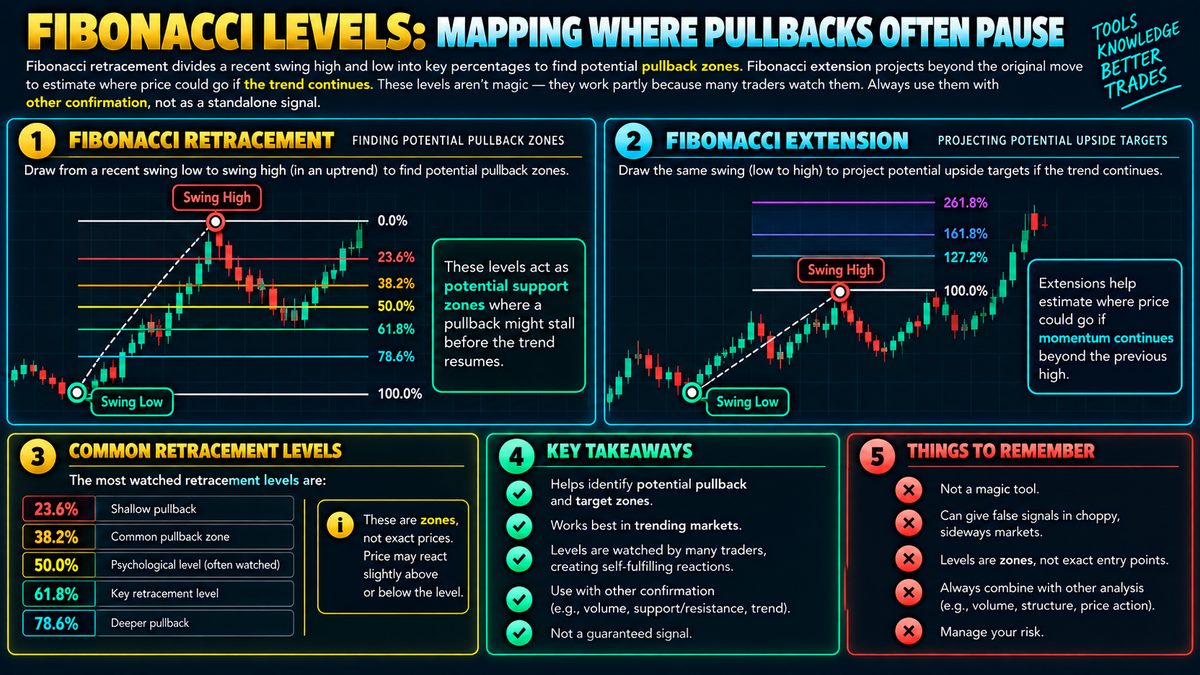
Fibonacci retracement takes a recent swing high and low and divides that range into key percentages (like 38%, 50%, 61.8%) to flag zones where a pullback might stall before the trend resumes. Extensions project beyond the original move to estimate where price could go if the trend continues. These levels aren't magic—they work partly because so many traders watch them, creating self-fulfilling reactions. Always combine them with other confirmation like volume or support/resistance, not as a standalone signal.
Where The Numbers Come From
Fibonacci retracement is based on a sequence of numbers discovered centuries ago, where each number is the sum of the two before it. Traders do not care about the sequence itself but about certain ratios that appear when you divide numbers in it against each other, most commonly 23.6%, 38.2%, 50%, 61.8%, and sometimes 78.6%. In trading, these percentages are used to slice up the distance between a recent swing high (a notable peak in price) and a swing low (a notable trough) to mark potential turning points within a pullback, which is a temporary move against the main trend.
To draw it, a trader picks a clear high and low on a chart and stretches a retracement tool between them. The software then automatically marks horizontal lines at each ratio inside that range. If price is trending upward and then pulls back, traders watch whether that pullback stalls near one of these lines before potentially resuming the uptrend. The same idea works in reverse for downtrends, measuring bounces instead of pullbacks.
Reading Retracements In Practice
The core idea is that markets rarely move in a straight line. After a strong move, some profit-taking or hesitation is normal, and Fibonacci levels give traders a rough map of where that hesitation might end. The 50% level, while not technically a Fibonacci ratio, is included by convention because halfway retracements are common. The 61.8% level is often called the golden ratio and is watched closely because a pullback beyond it can suggest the original trend is weakening rather than just pausing.
Traders typically treat these levels as zones of interest rather than exact prices. For example, imagine a coin that moved from 100 to 200. A pullback toward the 150 area, roughly the 50% level, might be watched as a spot where buyers could step back in, but nothing guarantees that will happen.
Extensions And Projecting Further
While retracements measure a pullback within an existing move, extensions attempt to project where price could travel if the trend continues past its previous high or low. Common extension levels include 127.2%, 161.8%, and 200%. These are drawn using the same swing points but stretched beyond the original range, giving traders a rough idea of potential future zones rather than a firm target.
Extensions are often used to set general expectations for how far a continuation might travel, or to think about where a trade thesis might be reconsidered, not as a precise forecast of where price must go.
Why These Levels Often Matter
Part of why Fibonacci levels seem to work is genuinely psychological rather than mathematical. Because so many traders, both retail and professional, plot the same ratios on the same swing points, orders tend to cluster near those same zones. This creates a degree of self-fulfilling behavior, where the level matters partly because enough people are watching it and acting accordingly.
Limitations And Sensible Use
Fibonacci tools are subjective. Different traders may choose different swing highs and lows, producing different lines on the same chart. The levels also do not explain why price might react, only where it might. They work best as one layer of analysis, combined with other tools such as trading volume, established support and resistance areas, or trend indicators, rather than used alone.
No retracement or extension level guarantees a reaction, and price can easily pass straight through them. Treating these tools as probability zones rather than certainties, and pairing them with clear risk management such as predefined stop-loss points and sensible position sizing, is a more realistic way to incorporate them into a broader trading approach.