
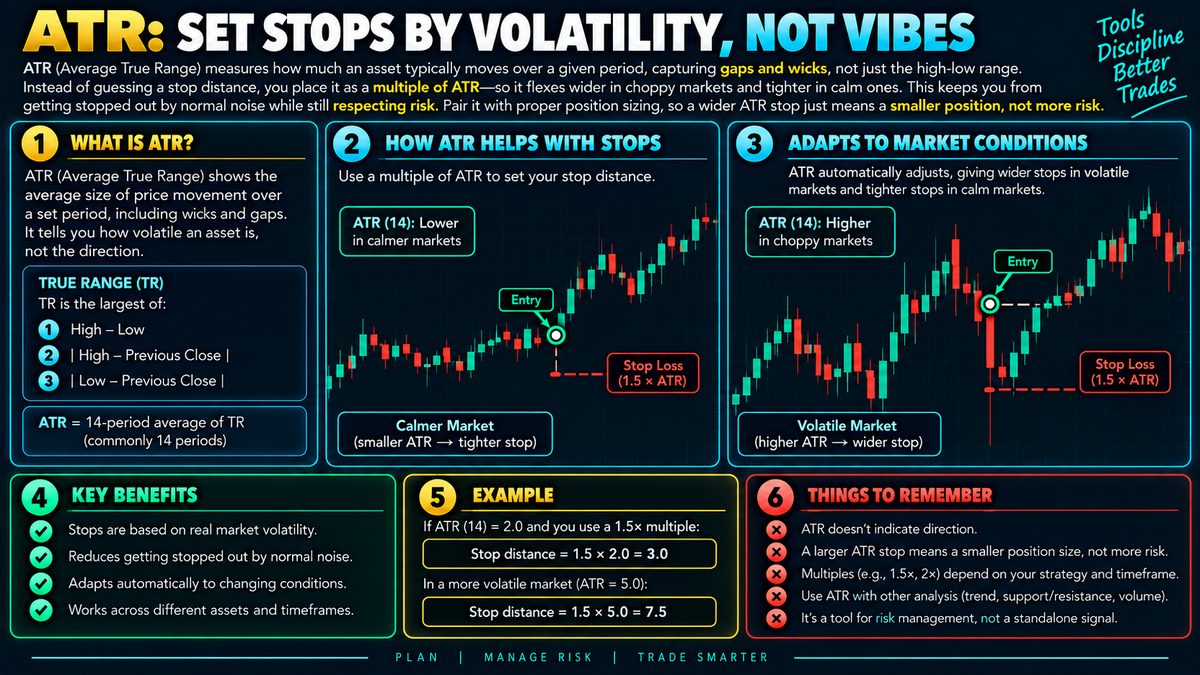
ATR measures how much an asset typically moves over a given period, capturing gaps and wicks, not just the high-low range. Instead of guessing a stop distance, you place it as a multiple of ATR—say 1.5x—so it flexes wider in choppy markets and tighter in calm ones. This keeps you from getting stopped out by normal noise while still respecting risk. Pair it with proper position sizing so a wider ATR stop just means a smaller position, not more risk.
What ATR Actually Measures
Average True Range, or ATR, is a way of measuring how much an asset typically moves over a set period, like 14 candles on whatever timeframe you're watching. Unlike a simple high-low range, ATR also accounts for gaps, those jumps where price opens far from where it closed last time, and long wicks, the thin lines on a candlestick showing a price spike that got rejected. It does this by calculating the "true range" for each candle, which is the largest of three values: the current high minus the current low, the current high minus the previous close, or the current low minus the previous close. Averaging these true ranges over your chosen period gives you the ATR figure.
The result is a single number in price terms, say 2 on a coin trading around 100, that tells you the typical size of a candle's movement recently. It is not a directional signal. ATR does not tell you whether price is going up or down, only how much it tends to swing regardless of direction.
Why Use It for Stops
A common mistake is picking a stop-loss distance arbitrarily, like always using 3 percent below entry, regardless of what the asset is actually doing. The problem is that a 3 percent move might be enormous noise for a calm asset and utterly trivial for a wild one. Using a fixed percentage or fixed dollar amount ignores context.
ATR-based stops solve this by scaling with real behavior. Instead of a flat distance, you place your stop at some multiple of ATR away from entry, commonly between 1 and 3 times ATR depending on how much room you want to give the trade. If ATR is 2 and you use a 1.5x multiple, your stop sits 3 away from entry. When volatility rises, ATR expands and your stop widens automatically. When things calm down, ATR contracts and your stop tightens. This keeps ordinary back-and-forth price action from triggering an exit before the actual trade idea has had a chance to play out.
Keeping Risk Constant
A wider stop is not the same as more risk, provided you adjust position size accordingly. This is the part traders often miss. If your stop distance doubles because volatility increased, and you keep your position size the same, you are risking twice as much money on that trade. The fix is to decide how much of your account you are willing to risk in dollar terms first, then divide that number by your stop distance to figure out how large a position you can take. A wider ATR stop simply means a smaller position, and a tighter one allows a larger position, while the actual amount at risk stays consistent trade to trade.
Limitations Worth Knowing
ATR is backward-looking. It describes recent behavior, not what is about to happen. A quiet market can turn volatile without warning, and a stop that looked reasonable yesterday might get overrun today. ATR also does not account for support, resistance, or any structural levels on the chart, so a purely mechanical ATR stop can sit right on top of an obvious level that would have made more sense to use.
Using It Alongside Other Tools
ATR works best combined with chart structure rather than in isolation. Many traders use it to fine-tune a stop that is already roughly placed near a technical level, adding a buffer so normal noise does not clip it early. It pairs naturally with position sizing rules and a predefined risk-per-trade limit. As with any single tool, ATR is not a guarantee of anything, markets can move against any stop placement, and no volatility measure removes the need for discipline and a broader risk management plan.