
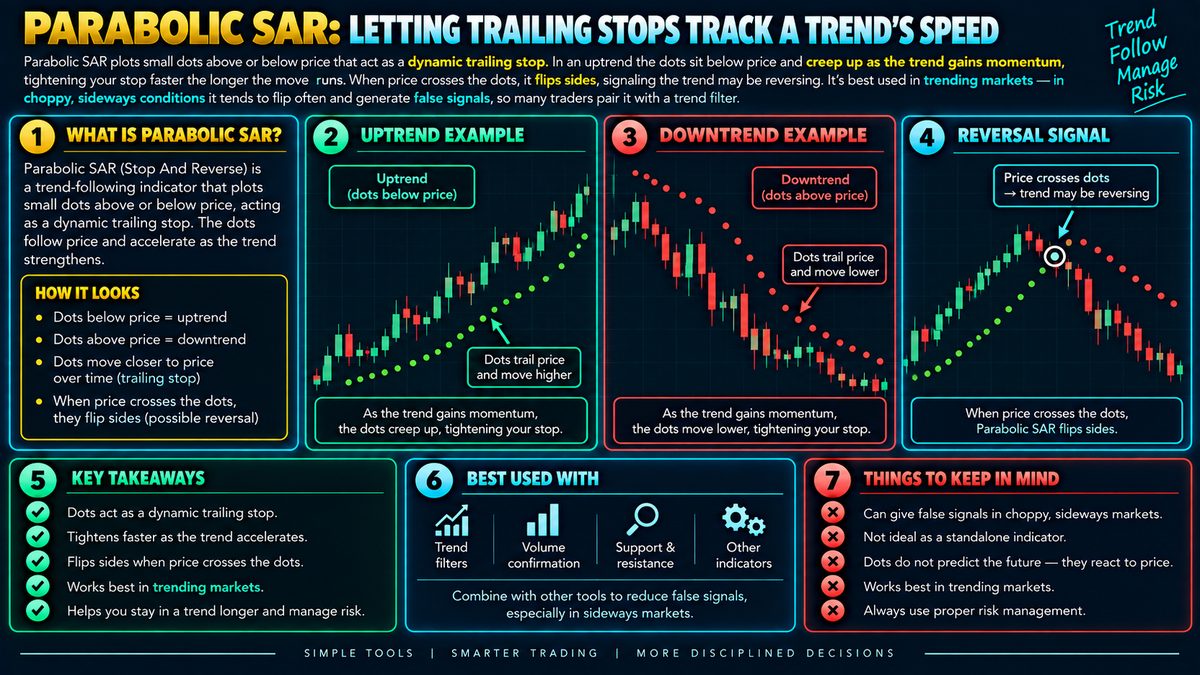
Parabolic SAR plots small dots above or below price that act as a dynamic trailing stop. In an uptrend the dots sit below price and creep up as the trend gains momentum, tightening your stop faster the longer the move runs. When price crosses the dots, it flips sides, signaling the trend may be reversing. It's best used in trending markets — in choppy, sideways conditions it tends to flip often and generate false signals, so many traders pair it with a trend filter.
What Parabolic SAR Actually Is
Parabolic SAR stands for "stop and reverse." It's a tool plotted directly on a price chart as a series of small dots, either below the candles during an uptrend or above them during a downtrend. Unlike a moving average, which smooths price into a line, SAR is designed specifically to act like a trailing stop that moves with the trend, getting tighter the longer the trend continues.
The word "parabolic" refers to the shape the dots trace over time. Early in a trend the dots move slowly, giving the trade room to breathe. As the trend persists, the dots accelerate and curve toward price faster, which is meant to lock in gains as momentum builds rather than giving them all back if the trend suddenly stalls.
How the Dots Are Calculated
Behind the scenes, SAR uses the prior period's extreme price plus an acceleration factor that increases each time a new high (in an uptrend) or new low (in a downtrend) is made. Because the acceleration factor compounds, the dots creep closer to price the longer a trend runs uninterrupted. A trader does not need to calculate this by hand since charting software plots it automatically, but understanding the mechanic explains why the tool tightens over time instead of trailing at a constant distance.
When price finally touches or crosses through the dots, the indicator flips sides. A dot that was below price suddenly appears above it, and this flip is the core signal the tool produces: it suggests the prevailing trend may be losing control and reversing, at least temporarily.
How Traders Commonly Use It
The most common use is as a visual trailing stop for an existing trend trade. If someone is long a hypothetical coin at 100 and it climbs to 130, the SAR dots would have crept up beneath price along the way, giving a rough level where the trader might reconsider the position rather than a fixed stop set once and forgotten.
Some traders also use the flip itself as an entry signal, treating a dot switching from above to below price as an early sign that an uptrend may be starting. Because SAR reacts quickly, it's often paired with something slower, such as a longer moving average or a trend-strength reading, so a flip is treated as more meaningful when it agrees with the broader direction rather than acted on alone.
Common Mistakes and Its Limitations
The biggest mistake is using Parabolic SAR in a sideways, range-bound market. Because the tool assumes a trend exists, choppy price action causes the dots to flip back and forth rapidly, generating a string of signals that would have led to repeated small losses if each flip were traded. This is often called whipsaw, and it's the tool's most cited weakness.
Another limitation is that SAR is a lagging tool, it reacts to price that has already moved rather than predicting where price will go next. Like any indicator, it can be wrong, and a flip is a probability shift, not a guarantee of a reversal.
Fitting It Into a Broader Approach
Because of its trend dependence, Parabolic SAR is generally paired with a way of confirming that a trend is actually underway, such as a longer-term moving average, a trend-strength indicator, or simple visual structure of higher highs and higher lows. Combining tools this way doesn't remove risk, but it can reduce how often a trader reacts to noise.
As with any technical tool, position sizing and predefined risk limits matter more than the indicator itself. Parabolic SAR can help structure an exit plan, but it should be treated as one input among several rather than a standalone system for deciding trades.