
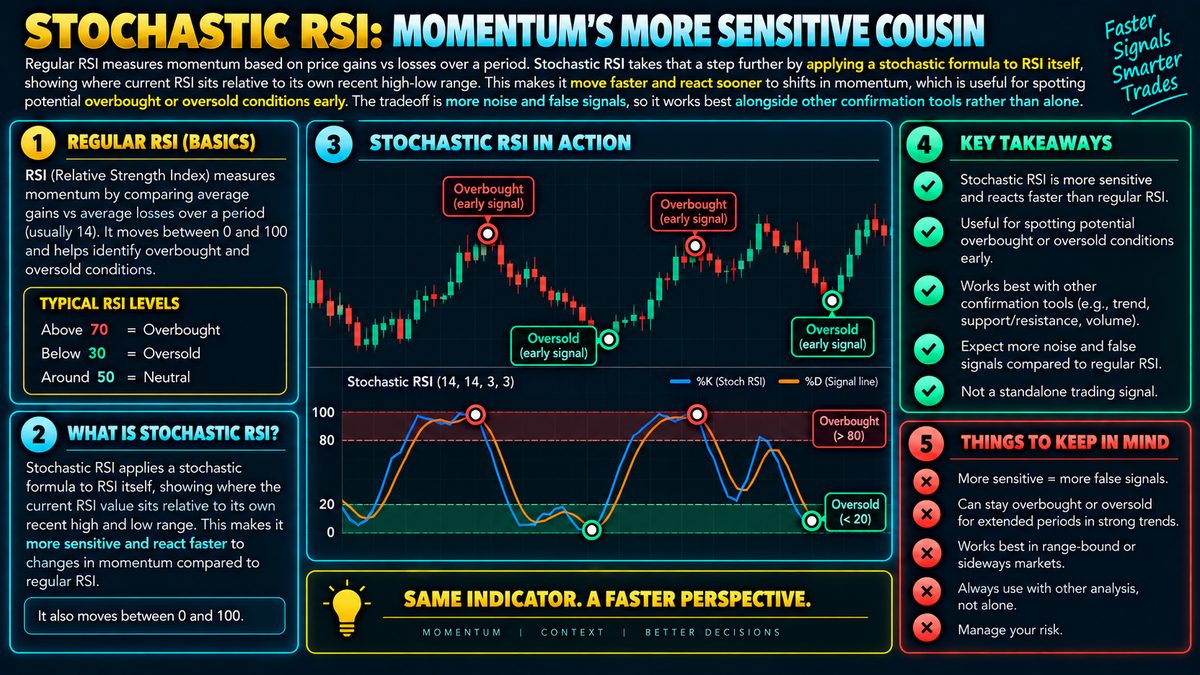
Regular RSI measures momentum based on price gains vs losses over a period. Stochastic RSI takes that a step further by applying a stochastic formula to RSI itself, showing where current RSI sits relative to its own recent high-low range. This makes it move faster and react sooner to shifts in momentum, which is useful for spotting potential overbought or oversold conditions early. The tradeoff is more noise and false signals, so it works best alongside other confirmation tools rather than alone.
What It Actually Measures
Regular RSI, short for Relative Strength Index, looks at how strong recent price gains have been compared to recent price losses over a chosen period, often 14 candles. It produces a value between 0 and 100, where higher readings suggest buying momentum has been dominant and lower readings suggest selling has been dominant.
Stochastic RSI takes that RSI value and runs it through a second calculation called a stochastic formula. Instead of asking whether momentum itself is strong, it asks where the current RSI value sits compared to its own highest and lowest readings over a recent window. If RSI has been bouncing between 40 and 70 lately, and it is now at 68, Stochastic RSI would show a very high reading because 68 is near the top of that recent range, even though 68 is not extreme on the plain RSI scale.
Why It Reacts Faster
Because Stochastic RSI measures RSI relative to its own recent range rather than against fixed levels like 30 or 70, it tends to swing between its extremes more quickly. This added sensitivity is the whole point of the indicator. Traders who feel that regular RSI is too slow to flag shifts in momentum often turn to Stochastic RSI because it can signal a potential overbought or oversold condition sooner, sometimes well before RSI itself reaches those classic threshold levels.
This speed comes from the double layer of calculation. Applying a stochastic formula to something that is already a derived value, RSI, amplifies small changes, which is why the resulting line can look choppier and more jagged on a chart.
Common Ways Traders Read It
Most platforms display Stochastic RSI as a value between 0 and 100, often with two lines similar to a moving average crossover, plus horizontal reference lines around 20 and 80. Readings near 80 are commonly treated as a sign momentum may be stretched to the upside, while readings near 20 suggest it may be stretched to the downside. Some traders also watch for the two lines crossing each other as a hint that short term momentum is turning.
It is also used to look for divergence, which is when price makes a new high or low but Stochastic RSI does not confirm it with a matching new extreme. Some see this as an early warning that momentum is weakening even while price is still moving in one direction. None of this guarantees a reversal is coming, it is simply one more piece of context.
Where It Falls Short
The same sensitivity that makes Stochastic RSI attractive is also its biggest weakness. Because it reacts so quickly, it can spend long stretches pinned near its extremes during a strong trend, generating repeated overbought or oversold signals that never lead to a meaningful reversal. Traders who react to every one of these signals in isolation often find themselves fighting a trend rather than trading with it.
It is also a lagging derivative of a derivative, meaning it is built entirely from past price behavior and has no way of knowing what happens next. A fast reading can flip back just as fast, so treating any single crossover or extreme reading as a firm signal is a common mistake.
Using It Alongside Other Tools
Because of this noise, Stochastic RSI is generally more useful as a supporting tool than a standalone trigger. Many traders pair it with a longer term trend read, such as a moving average, or with support and resistance levels, so that signals are only considered in the direction the broader market seems to be leaning. Combining it with volume or price action confirmation can help filter out weaker signals.
As with any indicator, position sizing and risk management matter more than the signal itself. No momentum tool, however sensitive, can predict future price movement with certainty, and Stochastic RSI should be treated as one input among several rather than a decision maker on its own.