
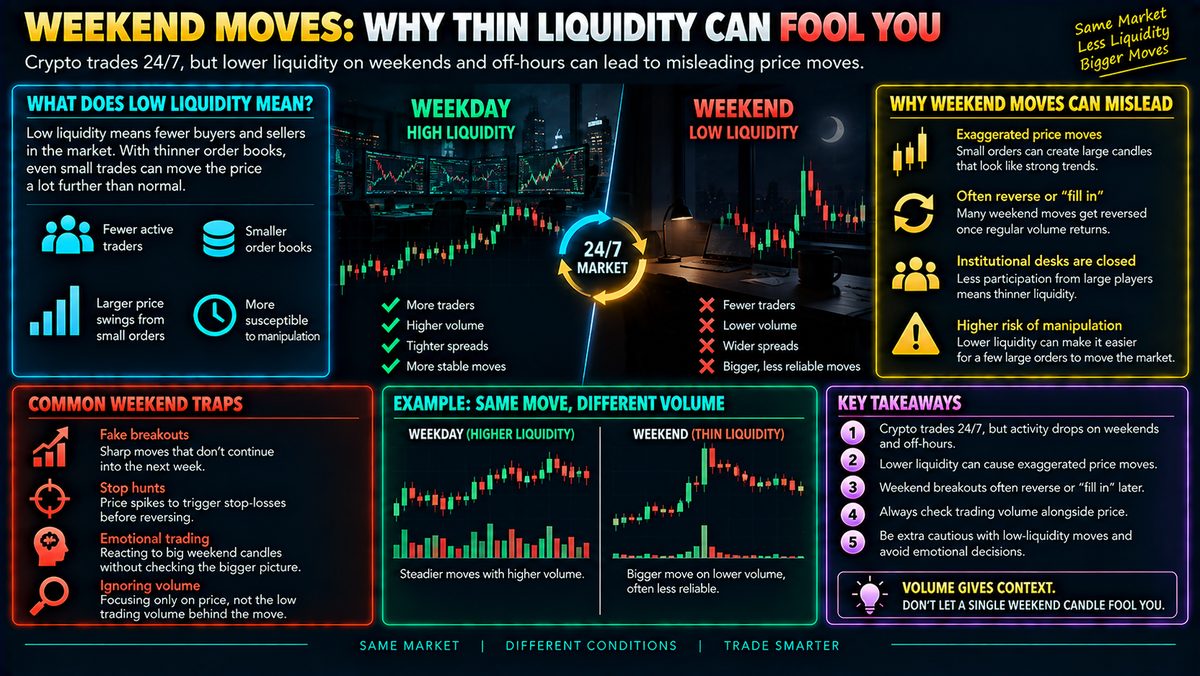
Crypto trades 24/7, but real trading activity drops sharply on weekends and during off-hours when institutional desks are closed. With fewer buyers and sellers, even small orders can push price further than they would on a busy weekday, creating sharp candles that look like strong trend signals. These moves often "fill in" or reverse once regular volume returns, so treat low-liquidity breakouts with extra caution. Check volume alongside price before reacting to any sudden weekend spike.
What Liquidity Actually Means
Liquidity is simply how easy it is to buy or sell an asset without moving its price much. When liquidity is high, there are lots of buyers and sellers sitting at many different price levels, so a single trade barely nudges the market. When liquidity is low, there are far fewer participants, and even a modest order can push the price noticeably higher or lower because there isn't enough opposing volume to absorb it.
Crypto markets never technically close, unlike traditional stock markets which have set trading hours. But "always open" does not mean "always active." Many of the largest participants, trading desks, funds, and institutional players, operate on business-day schedules tied to traditional finance. When they step away on weekends or during off-hours, a meaningful chunk of the market's normal depth disappears, even though the charts keep printing candles as if nothing changed.
Why Weekends Distort Price Action
With fewer active participants, the order book, the list of pending buy and sell orders at various prices, becomes thinner. Imagine a coin that normally needs a large order to move one percent, but on a quiet Sunday it only takes a tenth of that size to cause the same move. The price change looks identical on a chart, but the effort behind it is completely different.
This is why weekend candles can appear dramatic, long wicks, sudden spikes, or sharp breakouts, without any real shift in the underlying supply and demand story. A trader glancing only at price might interpret this as a powerful new trend starting, when in reality it may just be a handful of orders moving through a shallow market.
Why These Moves Often Reverse
When regular trading activity resumes, more buyers and sellers return, and liquidity refills. If the weekend move was not backed by genuine broad-based interest, price can drift back toward where it was before, a process sometimes called "filling in" the move. This does not always happen, but it happens often enough that experienced traders treat thin-liquidity breakouts with skepticism rather than excitement.
The core issue is that a price move by itself does not tell you why it happened. A spike caused by ten large orders in an empty market looks the same on a candlestick chart as a spike caused by genuine widespread demand. Only additional context can help separate the two.
Using Volume as a Reality Check
Volume, the amount of the asset actually traded in a given period, is one of the simplest tools for adding that context. If price makes a sharp move but volume is unusually low compared to typical weekday levels, that is a signal to be cautious rather than confident. A move accompanied by strong, sustained volume carries more weight than one made on a trickle of trading activity.
Comparing current volume to a recent average, rather than looking at it in isolation, tends to be more informative. No single volume reading guarantees anything, but persistent low volume during a big price swing is a reasonable warning sign worth noting.
Practical Takeaways and Limitations
None of this means weekend moves are always false or that weekday moves are always reliable, markets are messier than any simple rule. Genuine news events or shifts in sentiment can happen on any day of the week, including weekends. The goal is not to ignore weekend price action entirely but to weigh it differently.
Combining price with volume, waiting for confirmation once regular trading hours resume, and avoiding oversized reactions to thin-liquidity candles are reasonable habits. Risk management tools like position sizing and stop losses matter here as much as anywhere, since low-liquidity environments can also make it harder to exit at the price you expect. No indicator or pattern removes uncertainty completely, and this guide is educational, not a signal to act on.