
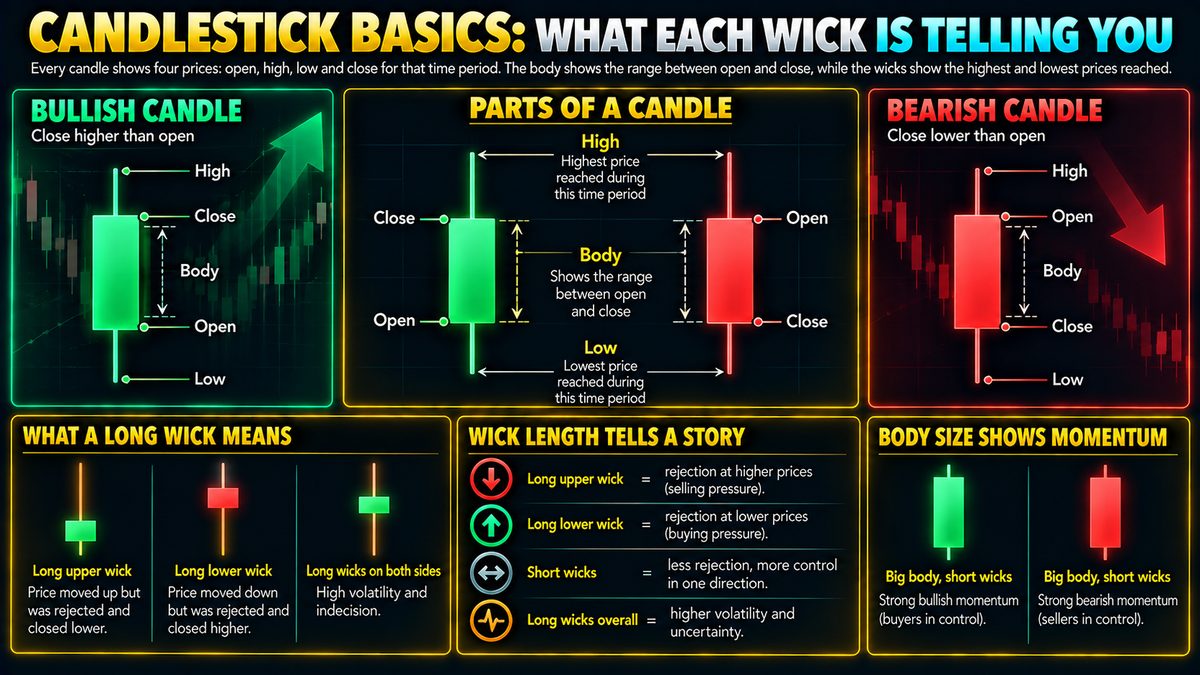
Every candle shows four prices: open, high, low, and close for that time period. The thick part (the "body") shows the range between open and close, while the thin lines ("wicks") show the highest and lowest prices reached. A long wick means price moved sharply in one direction but got pushed back, often signaling rejection at that level. Short wicks with a big body suggest strong, decisive momentum in one direction.
Reading The Anatomy Of A Candle
Every candlestick summarizes trading activity over a chosen time period, whether that is one minute, one hour, or one day. It always encodes four numbers: the open (the first price traded), the high (the highest price reached), the low (the lowest price reached), and the close (the last price traded). The body, which is the thick rectangular part, spans between the open and the close. If the close is above the open, the body is often colored one way, commonly a lighter shade; if the close is below the open, it is colored the opposite way, commonly a darker shade. Different charting tools may use different color schemes, so it is worth checking the legend rather than assuming.
The wicks, sometimes called shadows, are the thin lines extending above and below the body. The upper wick shows how far price pushed up before being pulled back down by the close of that period. The lower wick shows how far price pushed down before being pulled back up. Together, the body and wicks give a compressed picture of the fight between buyers and sellers during that window of time.
What Long Wicks Can Suggest
A long upper wick means buyers pushed price higher during the period, but sellers stepped in strongly enough to drag the close back down toward or below the open. Traders often interpret this as a sign of rejection at that higher level, meaning the market tested a price and could not hold it. A long lower wick works in reverse: sellers pushed price down, but buyers absorbed that pressure and pulled the close back up, which some traders read as rejection of the lower price.
It is important to remember this is an interpretation, not a fact. A long wick tells you what happened during that period, but it does not tell you why, and it does not guarantee what will happen next. The same wick pattern can appear before a continuation of the prior trend or before a reversal, depending on the wider context.
What Small Wicks And Big Bodies Suggest
When a candle has a large body and very short wicks on either end, it suggests that price moved in mostly one direction for the whole period with little pushback. For example, imagine a candle where price opened at 100 and closed at 110 with barely any wick above or below. That would suggest fairly one-sided, decisive buying pressure for that stretch of time, since there was little attempt to trade outside the open-to-close range.
This kind of candle is often described as showing strong momentum, but strong momentum in one period does not mean it will continue in the next period. Momentum can fade or reverse immediately after a decisive-looking candle.
Context Matters More Than Any Single Candle
A single candle rarely tells a complete story. Traders typically look at wicks and bodies in the context of recent candles, the overall trend, and levels where price has reacted before. A long wick appearing after a strong trend and near a level where price has previously reversed carries more weight in many traders analyses than the same wick appearing in the middle of a quiet, directionless stretch.
Volume, which shows how much was traded during that period, is often used alongside candlestick shape, since a long wick on very low volume may mean less than one formed with high volume.
Common Mistakes And Limitations
A frequent mistake is treating any single wick or candle as a firm signal on its own, without checking the surrounding trend, support and resistance levels, or trading volume. Another is assuming a pattern that worked in the past will repeat with the same outcome, when markets are shaped by constantly shifting participants and conditions.
Candlestick shapes are descriptive, not predictive in any guaranteed sense. They are one input among many, and using them well usually means combining them with other tools and sound risk management, such as position sizing and stop losses, rather than relying on a wick or body shape alone.