
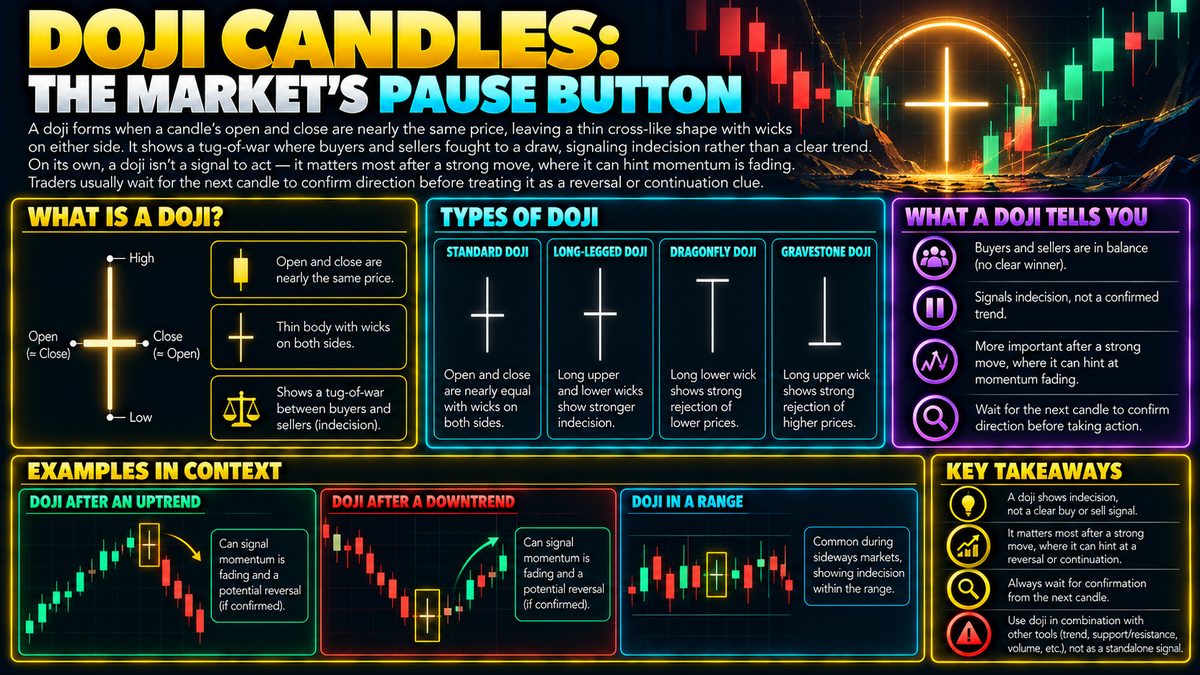
A doji forms when a candle's open and close are nearly the same price, leaving a thin cross-like shape with wicks on either side. It shows a tug-of-war where buyers and sellers fought to a draw, signaling indecision rather than a clear trend. On its own, a doji isn't a signal to act — it matters most after a strong move, where it can hint momentum is fading. Traders usually wait for the next candle to confirm direction before treating it as a reversal or continuation clue.
What A Doji Actually Shows
A candlestick chart records four prices for any given time period: the open, the close, the high, and the low. The thick part of the candle, called the body, stretches between the open and close, while the thin lines above and below, called wicks or shadows, mark the extremes of the period. A doji happens when the open and close land almost on top of each other, so the body shrinks down to little more than a horizontal line, often with wicks poking out on both sides like a cross or a plus sign.
That shape is not random. It means that over the course of the candle's timeframe, price may have pushed up, pulled back down, or done both, but by the time the period closed, buyers and sellers had essentially cancelled each other out. Neither side won. This is why traders describe a doji as a picture of indecision rather than a picture of direction.
Where Doji Candles Tend To Show Up
Doji candles can technically appear anywhere on a chart, but they only start to carry meaning in certain contexts. A doji sitting in the middle of a quiet, sideways market usually says very little, since the market was already indecisive before it formed. It becomes more interesting after a strong, sustained move up or down, because that is where a sudden pause can suggest the momentum behind that move is running out of steam.
Imagine a hypothetical coin that has been climbing steadily from 100 toward 150 over several candles. If a doji then appears after that run, it can hint that buyers pushed one more time, sellers matched them, and the one-sided enthusiasm that drove the rally may be fading. The same logic applies in reverse after a steep decline.
How Traders Read The Signal
On its own, a doji is not a buy or sell trigger. Most traders treat it as a flag that says pay attention, not act now. The common approach is to wait for the candle that forms immediately after the doji, sometimes called the confirmation candle. If that next candle pushes strongly in the opposite direction of the prior trend, some traders read that as support for a possible reversal. If it instead continues in the same direction as the original trend, the doji may just have been a brief pause within an ongoing move rather than a turning point.
Traders also pay attention to where the doji sits relative to recent support or resistance levels, and to the trading volume around it, since a pause backed by very light participation carries less weight than one that formed during heavy activity.
Common Mistakes And Limitations
A frequent mistake is treating every doji as a reversal signal regardless of context, which leads to reading meaning into shapes that formed during ordinary, low-conviction chop. Another is acting immediately on the doji itself instead of waiting for confirmation, since price can just as easily resume the original trend. Doji candles also do not tell you how large any following move might be, only that hesitation occurred.
It is worth remembering that no single candle pattern is a guarantee of anything. Markets are influenced by countless factors, and a doji reflects only what happened in one narrow window of time.
Fitting It Into A Broader Approach
Because a doji is a fairly limited piece of information, most traders combine it with other tools such as trend analysis, support and resistance zones, or momentum indicators before drawing conclusions. Sound risk management, including position sizing and predefined exit points, remains essential regardless of what any single candle suggests, since even a well confirmed doji pattern can fail.