
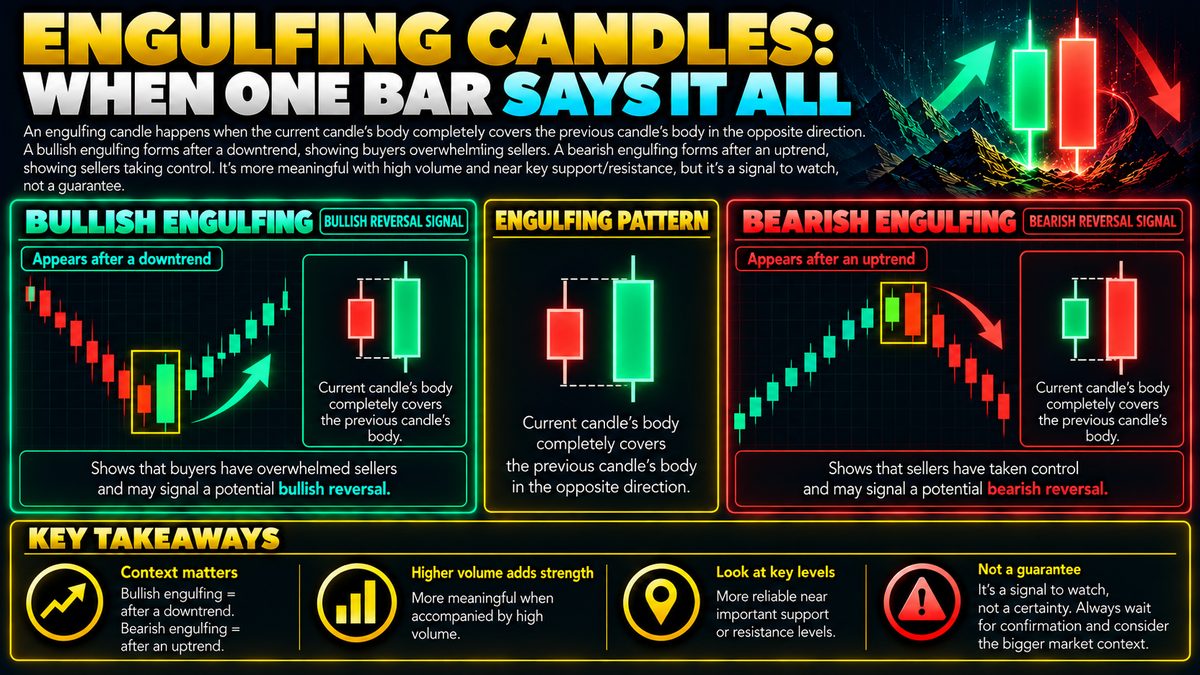
An engulfing candle happens when the current candle's body completely covers the previous candle's body in the opposite direction. A bullish engulfing forms after a downtrend, showing buyers overwhelming sellers. A bearish engulfing forms after an uptrend, showing sellers taking control. It's more meaningful with high volume and near key support/resistance, but it's a signal to watch, not a guarantee.
What An Engulfing Candle Actually Looks Like
A candlestick chart shows price movement over a set time period, whether that's one minute, one hour, or one day. Each candle has a body, which represents the range between the opening price and the closing price, and often thin lines above and below called wicks or shadows, which show the highest and lowest prices reached during that period.
An engulfing candle is a two-candle pattern. The first candle has a body of a certain size and direction. The second candle's body completely covers, or engulfs, the entire body of the first one, and it forms in the opposite direction. So if the first candle closed lower than it opened, the engulfing candle would open lower and close higher, with its body stretching beyond both the open and close of the prior candle. The wicks do not need to be engulfed, only the bodies.
Bullish Versus Bearish Engulfing
A bullish engulfing candle typically appears after a period of declining prices. The first candle is a down candle, showing sellers in control. The second candle opens near or below the prior close, then buyers push price up so strongly that the new candle's body swallows the entire previous body. This is read as a possible shift in momentum, suggesting buyers have stepped in with enough force to overwhelm the selling pressure that came before.
A bearish engulfing candle is the mirror image. It tends to show up after a period of rising prices. The first candle is an up candle. The second candle opens higher or near the prior close, then sellers take over and push the close below the prior open, with the new red body completely covering the previous green one. Traders interpret this as a sign that sellers may be regaining control after a period of buyer dominance.
Why Context Matters More Than The Candle Itself
An engulfing pattern that appears in the middle of a sideways, directionless market carries far less weight than one appearing after a clear, extended trend. The logic is that the pattern represents a tug of war between buyers and sellers, and that tug of war means more when it happens at a meaningful turning point rather than in random noise.
This is why many traders pay closer attention to engulfing candles when they form near support or resistance. Support is a price area where a downtrend has previously paused or reversed because buying interest picked up. Resistance is the opposite, a price area where an uptrend has previously stalled because selling interest increased. An engulfing candle forming right at one of these zones can add weight to the idea that the zone is holding again, though it never confirms it will.
Volume As A Supporting Clue
Volume measures how much of an asset changed hands during a given period. An engulfing candle that forms on unusually high volume suggests that a large number of participants were actively involved in that shift, which some traders view as more convincing than a low volume engulfing candle that could simply reflect a quiet, thinly traded period where price moved easily without much real conviction behind it.
Still, volume is supporting evidence, not proof. High volume can accompany a genuine shift in sentiment, but it can also accompany a temporary spike that fades quickly.
Limitations And Common Mistakes
A frequent mistake is treating any engulfing candle as an automatic reversal signal, regardless of where it appears on the chart. Another is ignoring that markets can produce false signals, where an engulfing candle forms and price briefly moves as expected before reversing again. No candlestick pattern works in isolation every time, and this one is no exception.
Most experienced traders treat engulfing candles as one input among several, combining them with trend analysis, support and resistance levels, volume, and a clear risk management plan such as position sizing and stop losses, rather than relying on the pattern alone to make decisions.