
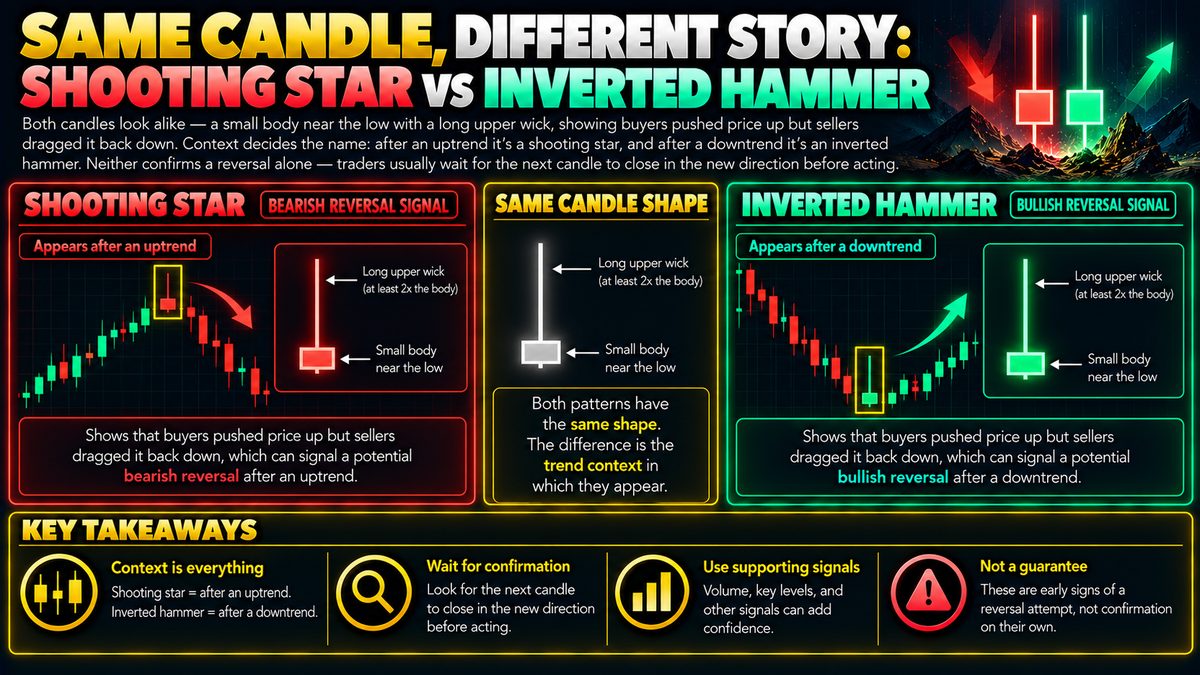
Both candles look alike — a small body near the low with a long upper wick, showing buyers pushed price up but sellers dragged it back down. Context decides the name: after an uptrend it's called a shooting star, warning buyers are losing control. After a downtrend, it's an inverted hammer, hinting sellers may be running out of steam. Neither confirms a reversal alone — traders usually wait for the next candle to close in the new direction before acting.
Reading the Shape Itself
A candlestick chart shows four numbers for a chosen time period: the open, the close, the high, and the low. The thick part, called the body, spans between the open and the close. The thin lines above and below, called wicks or shadows, show how far price stretched beyond that range before pulling back.
The candle in question has a small body sitting near the bottom of its range, with a long upper wick and little or no lower wick. Picture a coin opening near 100, rallying up to 110 during the period, then drifting back down to close near 101. That long upper wick tells you buyers tried to push price higher, but by the end of the period sellers had dragged it most of the way back down. On its own, this shape is neutral information. It only becomes meaningful once you look at what happened before it.
Context Decides the Name
If this candle appears after a sustained uptrend, traders call it a shooting star. The idea is that buyers pushed the price to a new high, showing continued enthusiasm, but were unable to hold it, which can hint that upward momentum is fading and sellers are starting to step in.
If the same shaped candle appears after a sustained downtrend, it is called an inverted hammer instead. Here the story is read differently: after a period of selling, buyers managed to push price up sharply within the candle, even though it closed back near the open. That failed push can be read as an early sign that selling pressure is weakening and some buyers are testing the waters.
The candle itself never changes. What changes is the story traders attach to it based on the trend that came before.
Why Confirmation Matters
Neither pattern is treated as a signal by itself. A shooting star after an uptrend suggests hesitation, not a guaranteed turn downward, because the next candle could easily push to new highs again. An inverted hammer after a downtrend suggests possible exhaustion among sellers, but the next candle could just as easily resume the decline.
For this reason, many traders wait for a confirmation candle. After a shooting star, confirmation might mean the following candle closes lower than the shooting star's body, supporting the idea that sellers have taken control. After an inverted hammer, confirmation might mean the next candle closes higher, supporting the idea that buyers are stepping in. Acting before that confirmation means trading on a guess about what the crowd will do next, which carries more risk.
Common Mistakes and Limitations
A frequent mistake is spotting the shape in isolation, without checking whether a genuine trend actually preceded it. Without a prior uptrend or downtrend, the pattern loses its usual interpretation entirely. Another mistake is treating the pattern as a certainty rather than a probability, which can lead to oversized positions or ignoring stop-losses.
These candles also say nothing about how strong a reversal might be, or how long it might last. They are a snapshot of one period's tug-of-war between buyers and sellers, not a forecast.
Fitting It Into a Broader Approach
Most traders combine these candle patterns with other tools, such as support and resistance levels, trading volume, or momentum indicators, to see whether multiple signals line up. Risk management tools like stop-loss orders and sensible position sizing remain important regardless of how convincing a pattern looks, since no single candle or indicator can guarantee what price will do next.