
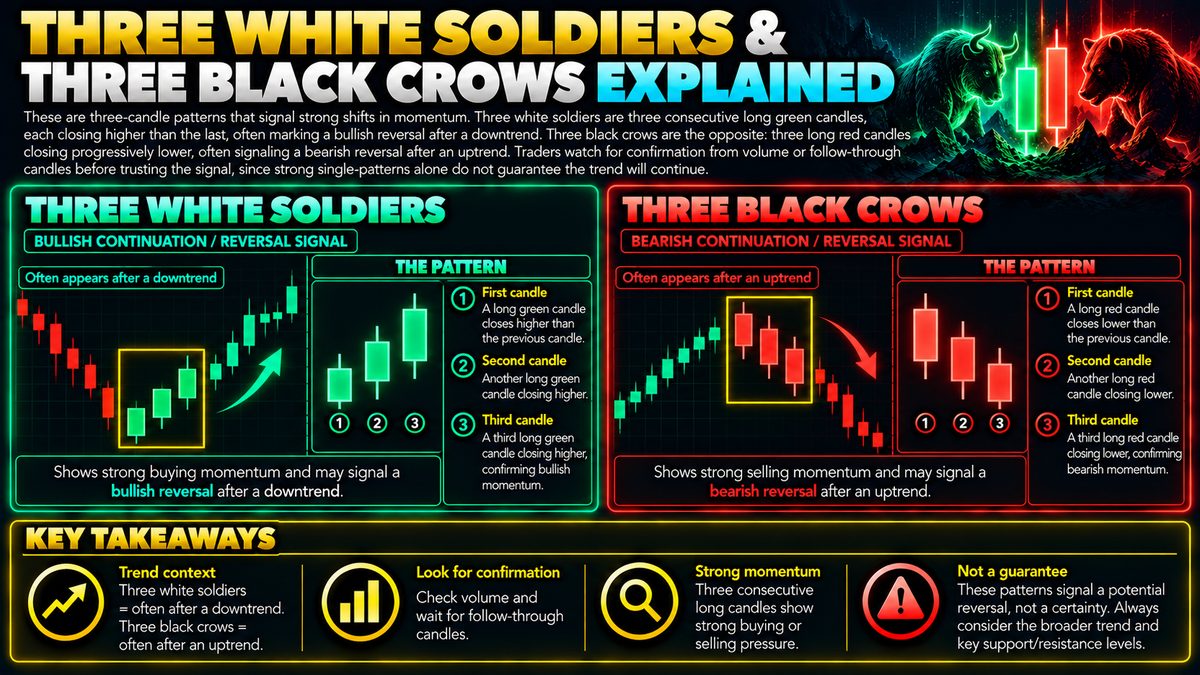
These are three-candle patterns that signal strong shifts in momentum. Three white soldiers are three consecutive long green candles, each closing higher than the last, often marking a bullish reversal after a downtrend. Three black crows are the opposite: three long red candles closing progressively lower, often signaling a bearish reversal after an uptrend. Traders watch for confirmation from volume or follow-through candles before trusting the signal, since strong single-patt
What The Patterns Look Like
Three white soldiers is a sequence of three candlesticks, each one showing a strong move up. A candlestick is a small chart shape that shows how a price opened, closed, and moved during a set time period, such as one hour or one day. In this pattern, each of the three candles opens within the body of the previous candle and closes near its own high, with each close sitting above the last one. Visually it looks like a steady staircase climbing upward, with little to no long wicks (the thin lines poking out of the candle body that show price rejection).
Three black crows is the mirror image. Three candles in a row each show a strong move down, opening inside the prior candle's body and closing near their own low, with each close lower than the last. It looks like a staircase descending, again with fairly short wicks, suggesting sellers were in control for the whole session rather than just a brief spike.
How These Patterns Form
Both patterns are read as a story about who is in control of the market, buyers or sellers. Three white soldiers often appears after a downtrend, a period where price has generally been falling. The idea is that sellers have been pushing price down, but over three consecutive periods, buyers step in with enough consistent strength to push price higher each time, hinting that momentum may be flipping from bearish (falling) to bullish (rising).
Three black crows typically appears after an uptrend, a period of generally rising prices. Three straight sessions of strong, steady selling suggest that buyers who had been driving the rally are losing conviction, and sellers are taking over, possibly marking a shift from bullish to bearish momentum.
How Traders Commonly Use Them
Traders generally treat these patterns as potential reversal signals, meaning a possible change in the direction of the trend rather than a continuation of it. Because the pattern spans three full candles, some traders see it as more convincing than a single-candle signal, since it shows sustained pressure in one direction rather than a single burst.
Even so, most experienced traders do not act on the pattern alone. They often look for confirmation, such as a follow-through candle in the same direction after the pattern completes, or a rise in trading volume, which is the amount of the asset bought and sold during that period. Higher volume during the pattern is sometimes viewed as a sign that the move has genuine participation behind it, rather than being driven by a handful of trades in a thin, illiquid market.
Common Mistakes And Limitations
A common mistake is treating the pattern as a guaranteed signal rather than one small piece of evidence. Candlestick patterns describe what has already happened, not what will happen next, and price can just as easily reverse again right after the pattern completes. Another mistake is spotting the pattern in isolation, ignoring the broader context such as whether it appears near a significant support or resistance level, which are price zones where buying or selling pressure has previously shown up.
The patterns can also appear in choppy, low-liquidity markets where they mean far less, since a handful of large orders can create three strong candles without reflecting a genuine shift in overall market sentiment.
Fitting Into A Wider Strategy
Because no candlestick pattern works in every situation, most traders combine these signals with other tools, such as trend indicators, momentum oscillators, or key support and resistance zones, to build a fuller picture before drawing conclusions. Risk management remains essential regardless of how convincing a pattern looks, since even well-formed patterns fail regularly. This can include position sizing, which is deciding how much capital to risk on any single idea, and predefined exit points to limit losses if the anticipated move does not materialize. Ultimately, these patterns are best treated as one input among many, not a standalone signal for making decisions.