
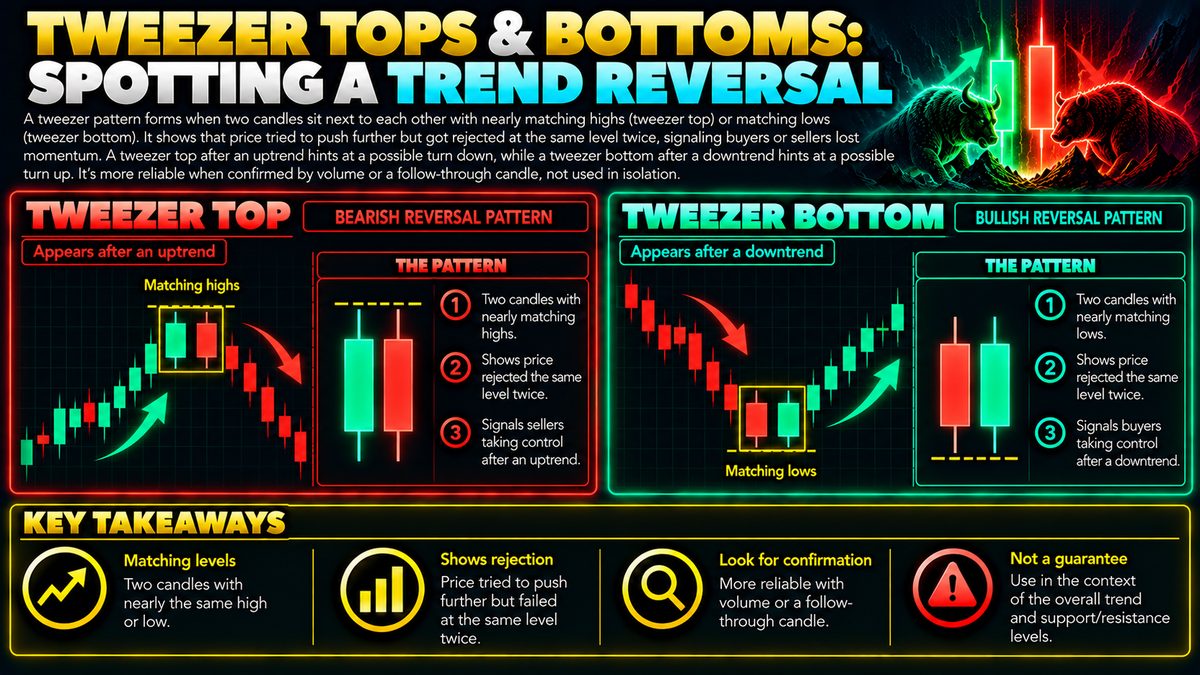
A tweezer pattern forms when two candles sit next to each other with nearly matching highs (tweezer top) or matching lows (tweezer bottom). It shows that price tried to push further but got rejected at the same level twice, signaling buyers or sellers lost momentum. A tweezer top after an uptrend hints at a possible turn down, while a tweezer bottom after a downtrend hints at a possible turn up. Like any single pattern, it's more reliable when confirmed by volume or a follow-through candle, not used in isolation.
What The Pattern Actually Looks Like
A candlestick chart shows price movement over a chosen time period, with each candle representing the open, close, high, and low for that stretch of time. A tweezer pattern is made of two candles sitting side by side that share almost the same high (a tweezer top) or almost the same low (a tweezer bottom). The bodies of the two candles can be different colors, different sizes, or even the opposite of each other in terms of which one is bullish or bearish. What matters is that the extreme point, the highest wick or the lowest wick, lines up closely between the two candles.
Imagine a coin trading near 100 that rallies up to 110, pulls back slightly the next candle, then rallies again to almost exactly 110 before falling back. Those two peaks touching the same ceiling twice in a row is a tweezer top. The mirror image at the bottom of a downtrend, where price tests the same floor twice and bounces both times, is a tweezer bottom.
Why This Pattern Forms
The logic behind a tweezer is about rejection. In an uptrend, buyers keep pushing price higher until it hits a level where selling pressure appears strong enough to stop it. The first candle tests that level and gets pushed back down. If the very next candle tries again and gets rejected at almost the same spot, it suggests the ceiling is not just a coincidence but a real area where sellers are stepping in with size.
The same idea applies in reverse at a tweezer bottom. Sellers drive price down to a level, but buyers absorb that selling not once but twice in a row. That repeated defense of a price level often reflects a shift in who is in control, even if it does not guarantee the shift will last.
How Traders Read The Signal
Traders generally treat a tweezer top as a caution sign that an uptrend may be losing steam, and a tweezer bottom as a hint that a downtrend may be running out of sellers. The pattern is usually given more weight when it appears after a clear, extended move in one direction, since a tweezer that shows up in a flat, choppy market carries much less meaning.
Some traders also pay attention to the size and shape of the two candles. A longer wick on the rejection candles, combined with a smaller body, can suggest stronger rejection at that level. None of this is a fixed rule, since candlestick reading always involves some degree of interpretation rather than an exact formula.
Confirmation And Common Mistakes
A common mistake is acting on a tweezer the moment it appears, without waiting for anything else to support it. Because the pattern is small and can form by chance, especially on short timeframes, many traders wait for a confirmation candle that closes clearly in the new direction before treating the reversal as more likely. Rising or falling trading volume around the pattern is also often used as a secondary check, since a rejection backed by heavier participation is generally considered more meaningful than one on light volume.
Another mistake is spotting tweezers on very short timeframes and assuming they carry the same weight as one on a daily chart. Patterns on lower timeframes appear far more often and are more prone to noise, so relying on them alone can lead to frequent false signals.
Fitting It Into A Broader Approach
A tweezer pattern is best treated as one small piece of evidence rather than a standalone signal. Traders often combine it with support and resistance levels, trend indicators, or momentum tools to see whether multiple signs line up together. Risk management remains essential regardless of how convincing a pattern looks, since no candlestick formation, including a tweezer, guarantees what price will do next. Position sizing and predefined exit points matter more to long-term outcomes than any single chart pattern.