
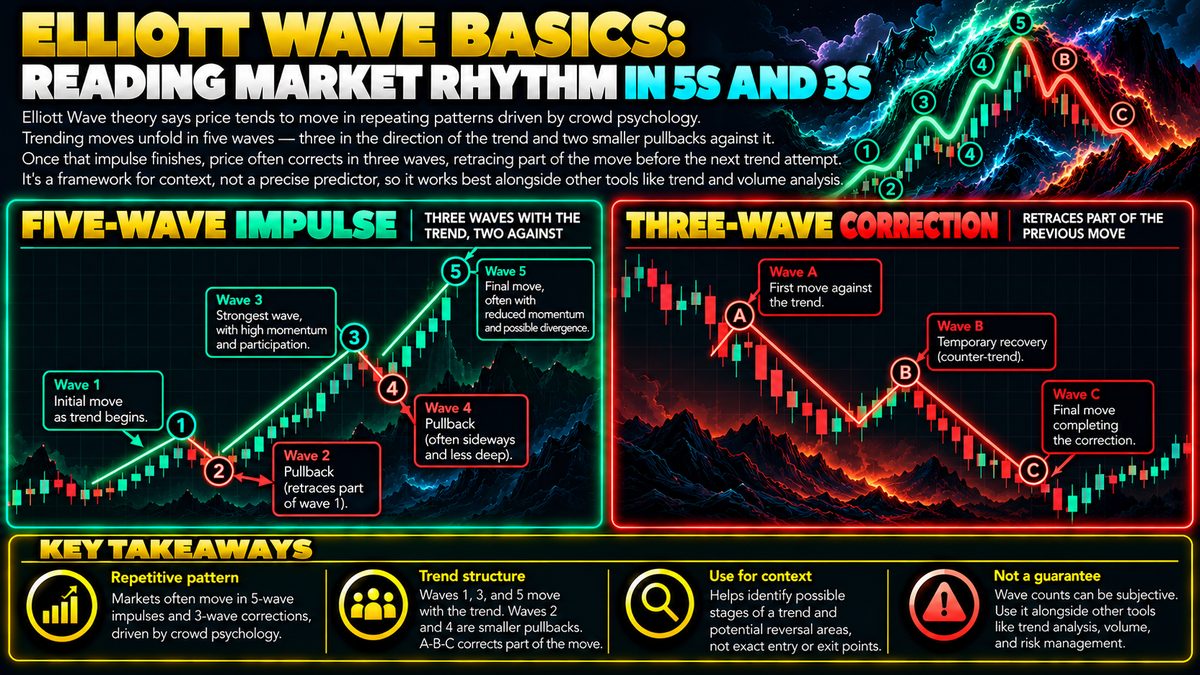
Elliott Wave theory says price tends to move in repeating patterns driven by crowd psychology. Trending moves unfold in five waves — three in the direction of the trend and two smaller pullbacks against it. Once that impulse finishes, price often corrects in three waves, retracing part of the move before the next trend attempt. It's a framework for context, not a precise predictor, so it works best alongside other tools like trend and volume analysis.
What Elliott Wave Theory Actually Claims
Elliott Wave theory is an idea developed decades ago that markets move in repeating rhythms because they are made up of people, and people tend to react to fear, greed, hope, and doubt in similar patterns over and over. Instead of moving in a straight line, price allegedly advances in a wave-like structure that reflects shifting crowd sentiment. The theory does not claim to predict exact price levels or dates. It offers a way to label what has already happened and form a rough map of what phase the market might be in.
The core building block is a set of eight waves: five that make up a move in the direction of the larger trend, followed by three that correct part of that move. Learning to recognize this five-then-three rhythm is the whole foundation of the framework.
The Five-Wave Impulse
In an uptrend, wave one is the initial push higher, often met with skepticism since it can look like a minor bounce. Wave two is a pullback that retraces some of wave one but, in a healthy pattern, does not fall below where wave one started. Wave three is typically the longest and strongest wave, driven by wider participation as more traders notice the move. Wave four is another pullback, usually shallower and choppier than wave two. Wave five is the final push, sometimes on weaker momentum than wave three even though price makes a new high.
The same logic works in reverse during downtrends, with five waves unfolding lower. The key idea is that three of the five waves push in the trend's direction while two interrupt it, giving the whole move a rhythmic, rather than random, feel.
The Three-Wave Correction
Once the five-wave impulse is thought to be complete, Elliott Wave theory suggests the market often corrects in three waves, labeled A, B, and C. Wave A is the initial move against the prior trend, wave B is a partial recovery that can fool traders into thinking the old trend has resumed, and wave C pushes further in the corrective direction, often extending beyond wave A. After this three-wave correction plays out, the theory suggests the market is set up for another attempt at trending, though not with certainty.
How Traders Try to Use It
Traders who use this framework mainly try to figure out which wave the market might currently be in, using that as context rather than a firm signal. For example, someone who believes a market is completing wave four might treat the zone with more caution, expecting one more push in the trend direction, while someone who believes wave five has already finished might expect a corrective pullback to follow. This is typically combined with trend lines, moving averages, or volume analysis to see whether momentum and participation support the wave count being considered.
Limitations and Common Mistakes
The biggest challenge with Elliott Wave analysis is that wave counts are subjective. Two analysts can look at the same chart and label the waves differently, and counts are often revised after the fact once more price data appears. Beginners commonly force a five-wave or three-wave label onto messy price action that does not fit cleanly, then trade with more confidence than the pattern deserves.
Because of this subjectivity, it is best treated as one piece of context among many rather than a standalone system. It works better alongside clear risk management, such as defined stop-loss levels and sensible position sizing, since no wave count, however convincing it looks in hindsight, guarantees what price will do next.