
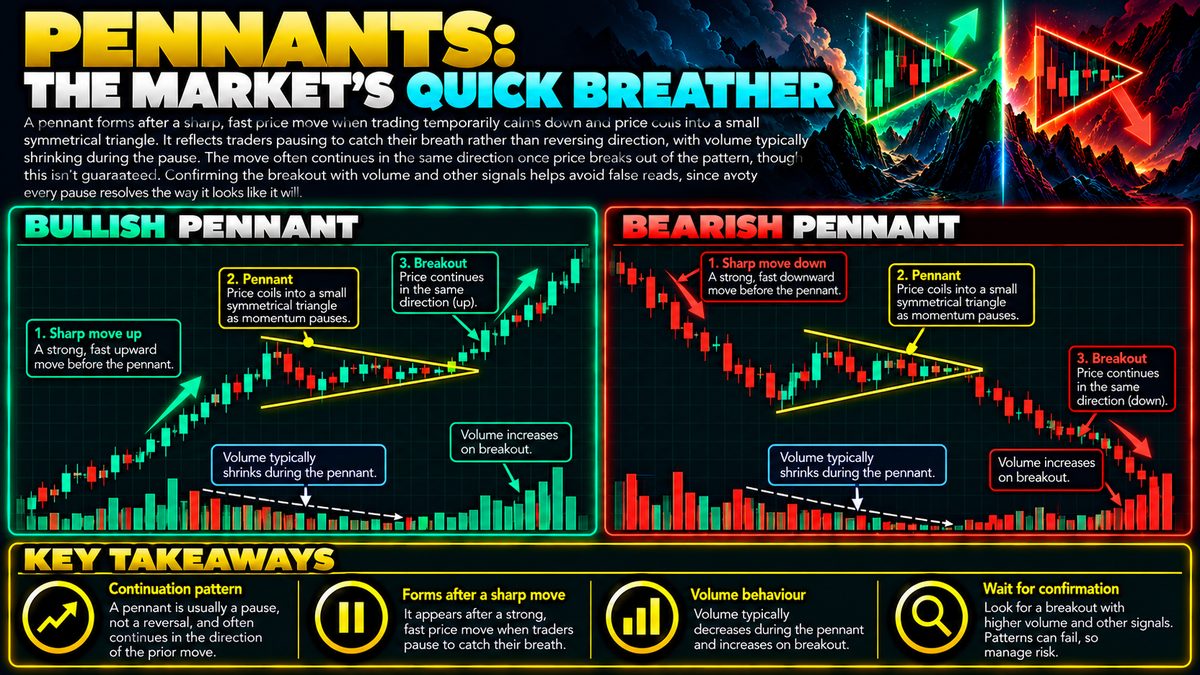
A pennant forms after a sharp, fast price move when trading temporarily calms down and price coils into a small symmetrical triangle. It reflects traders pausing to catch their breath rather than reversing direction, with volume typically shrinking during the pause. The move often continues in the same direction once price breaks out of the pattern, though this isn't guaranteed. Confirming the breakout with volume and other signals helps avoid false reads, since not every pause resolves the way it looks like it will.
What A Pennant Actually Is
A pennant is a short pause in price action that shows up after a sharp, fast move, sometimes called the flagpole. Once that quick surge or drop happens, buyers and sellers momentarily lose their sense of urgency and trading settles into a tight range. On a chart, this range looks like a small symmetrical triangle, with the highs sloping down and the lows sloping up until they nearly meet at a point. The flagpole plus this small triangle together form the full pennant pattern.
The name comes from its visual resemblance to a small triangular flag on a pole, which is exactly what the flagpole move plus the coiling price action looks like. It is considered a continuation pattern, meaning it typically appears in the middle of a trend rather than at its end, reflecting a pause rather than a reversal.
How It Forms
After a strong move, many of the traders who wanted in or out have already acted, so buying or selling pressure eases off temporarily. Price starts making smaller and smaller swings as the remaining participants trade cautiously, unsure whether to keep pushing in the same direction. This indecision creates the narrowing, symmetrical shape.
Volume usually shrinks during this consolidation phase. Think of a hypothetical coin that jumps from 100 to 130 in a burst, then spends the next several hours trading between 125 and 128 with quieter volume. That quiet coiling is the pennant. It is not that traders have decided the move is over, it is more that the market is catching its breath before deciding what to do next.
How Traders Commonly Read It
Traders often watch for price to break out of the narrowing triangle in the same direction as the original flagpole move, since a pennant is a continuation pattern. Some also measure the height of the flagpole and project a similar distance from the breakout point as a rough guide to how far the next move might travel, though this is only a general estimate, not a prediction.
Volume is a key part of how the pattern is read. A breakout accompanied by a noticeable pickup in volume is generally seen as more meaningful than one that occurs on thin, unconvincing volume, since higher participation suggests more traders are backing the move rather than it being a random blip.
Common Mistakes And Limitations
One common mistake is assuming every small triangle after a move is a genuine pennant. Similar-looking consolidations can form without leading to any continuation at all, and some resolve in the opposite direction of the flagpole, catching traders off guard. Pattern recognition is subjective, and two traders can look at the same chart and disagree on whether a valid pennant is even present.
Another limitation is that pennants are typically short-lived patterns, so timing matters and there is little room for hesitation once a breakout appears to be underway. False breakouts, where price pushes briefly through the triangle and then reverses, are common enough that treating any single breakout as a sure thing is risky. No chart pattern, including this one, offers a guarantee of what happens next.
Fitting It Into A Broader Approach
Because pennants can fail, many traders look for confirmation beyond the shape itself, such as volume trends, momentum indicators, or how price behaves relative to other support and resistance levels. Relying on a pattern in isolation tends to be less reliable than combining it with other context.
Risk management remains essential regardless of how convincing a pattern looks. This can include position sizing that reflects the uncertainty involved, and predefined plans for what happens if a breakout does not follow through. Pennants can be a useful piece of a trader's toolkit for reading market behavior, but they work best as one input among several rather than a standalone signal.