
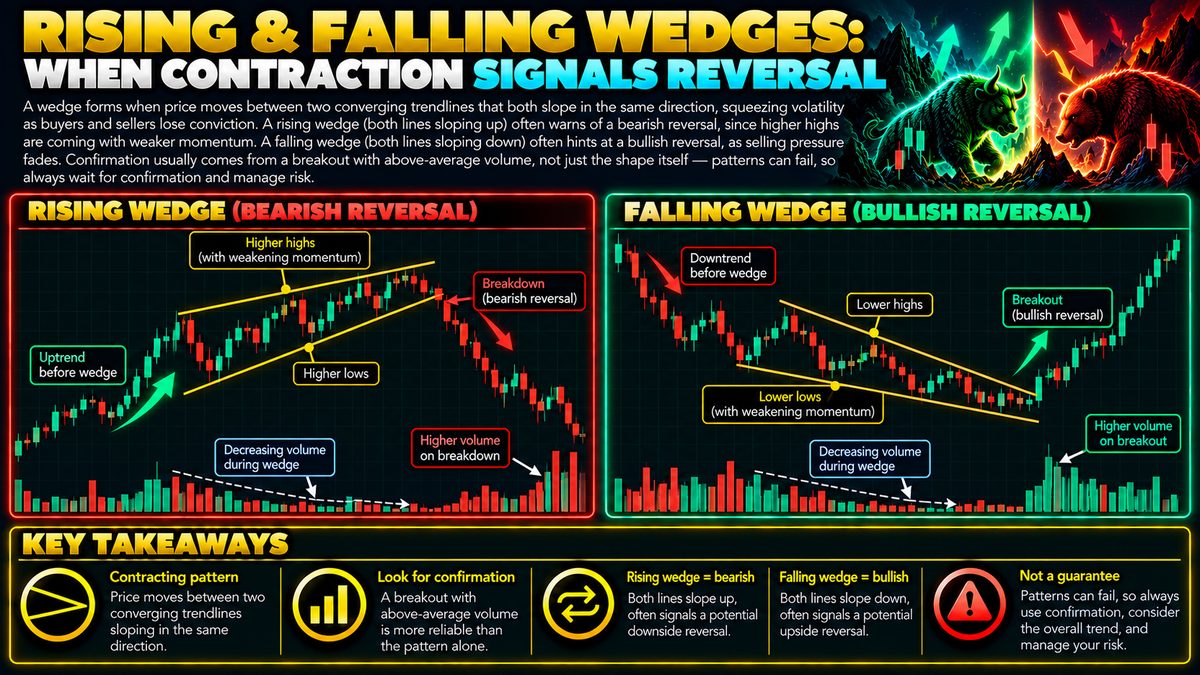
A wedge forms when price moves between two converging trendlines that both slope in the same direction, squeezing volatility as buyers and sellers lose conviction. A rising wedge (both lines sloping up) often warns of a bearish reversal, since higher highs are coming with weaker momentum. A falling wedge (both lines sloping down) often hints at a bullish reversal, as selling pressure fades. Confirmation usually comes from a breakout with above-average volume, not just the shape itself — patterns can fail, so always wait for confirmation and manage risk.
What A Wedge Actually Looks Like
A wedge is a chart pattern that appears when price action gets squeezed between two trendlines that both point in the same direction, either both tilting upward or both tilting downward. Unlike a simple channel where the lines run parallel, a wedge's lines converge, meaning the gap between the highs and lows narrows over time. This narrowing reflects a market where price swings are getting smaller even as the overall direction keeps drifting one way, a sign that conviction on both sides is fading.
Think of it like a hypothetical coin trading between 90 and 100 that keeps making higher lows and higher highs, but each new high is only slightly above the last, while each new low climbs faster than the highs do. Draw a line connecting the highs and another connecting the lows, and if both slope upward while pinching together, that is a rising wedge. The mirror image, both lines sloping downward and converging, is a falling wedge.
Rising Wedges And Bearish Reversal Signals
A rising wedge typically forms after an uptrend, though it can also appear in the middle of a downtrend as a pause. Price keeps pushing to new highs, which looks bullish on the surface, but the shrinking distance between the trendlines suggests each rally is weaker than the last. Momentum is fading even as price nudges upward, a divergence traders often view as a warning sign.
The pattern is considered more meaningful when it eventually breaks below the lower trendline, since that break suggests sellers have finally overwhelmed the diminishing buying pressure. This is read as a hint of a possible bearish reversal, though it is never a certainty. Price can also break upward out of a rising wedge, which would invalidate the bearish read entirely, so the pattern alone tells you nothing until it resolves.
Falling Wedges And Bullish Reversal Signals
A falling wedge is the inverse setup, usually appearing after a downtrend. Price makes lower lows and lower highs, but the lows are decelerating while the highs keep dropping toward them, squeezing the range. This suggests sellers are running out of steam even though price is technically still falling.
Traders often watch for a breakout above the upper trendline as a signal that buyers may be stepping back in, hinting at a possible bullish reversal. As with the rising wedge, the pattern can just as easily break the other way, and there is no guarantee that a falling wedge resolves upward simply because that is the textbook expectation.
Why Volume And Confirmation Matter
The shape of a wedge by itself is not a trigger to act. What separates a credible breakout from a false one is often the volume that accompanies it. A breakout on noticeably higher than average volume suggests real participation behind the move, while a breakout on thin volume is more likely to fizzle or reverse quickly.
Many traders also wait for the price to close beyond the trendline, rather than just poke through it briefly, before treating the pattern as confirmed. Some look for a retest of the broken trendline as additional evidence before considering the pattern valid.
Limitations And Risk Management
Wedges, like all chart patterns, are subjective. Two traders can draw the trendlines slightly differently and reach different conclusions about whether a wedge even exists. Patterns can also fail outright, breaking in the expected direction only to reverse again shortly after, or not breaking at all and dissolving into sideways noise.
Because of this, a wedge should never be treated as a guarantee of future direction. It works best as one piece of context alongside other tools such as momentum indicators, support and resistance levels, or broader trend analysis. Anyone trading around these patterns should think carefully about position sizing, use predefined risk limits, and accept that losses are a normal part of engaging with any pattern-based approach.