
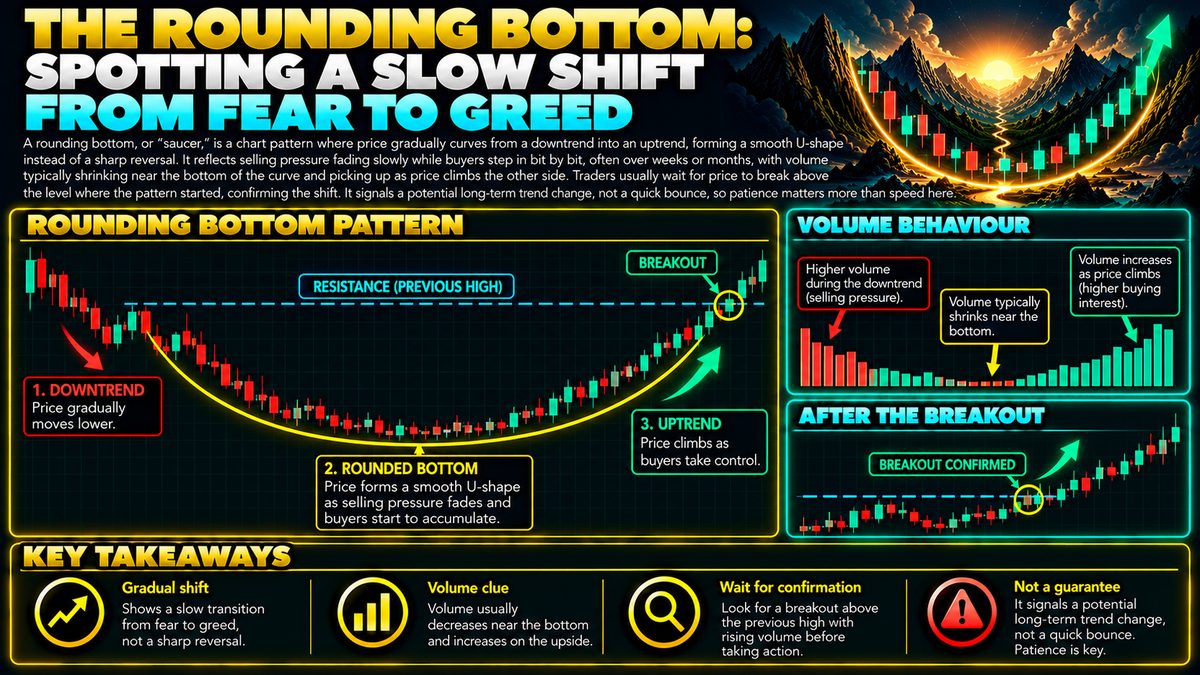
A rounding bottom, or "saucer," is a chart pattern where price gradually curves from a downtrend into an uptrend, forming a smooth U-shape instead of a sharp reversal. It reflects selling pressure fading slowly while buyers step in bit by bit, often over weeks or months, with volume typically shrinking near the bottom of the curve and picking up as price climbs the other side. Because it forms gradually, traders usually wait for price to break above the level where the pattern started, confirming the shift, rather than guessing the exact bottom. It signals a potential long-term trend change, not a quick bounce, so patience matters more than speed here.
What the pattern actually looks like
A rounding bottom is exactly what it sounds like: instead of price crashing down and snapping back up in a sharp V-shape, it drifts down slowly, flattens out, and then curls back up just as slowly. If you squint at the chart it resembles the inside of a saucer or a shallow bowl. There's no single dramatic low point, but rather a wide stretch of time where price wobbles sideways near the bottom before beginning its gradual climb.
This shape tends to show up on higher timeframes like daily or weekly charts, and it can take weeks or months to fully form. That's part of what makes it different from sharper reversal patterns. It's less about a moment and more about a slow change in mood among traders.
How it forms psychologically
Think of a downtrend as sellers being in control. Early in the pattern, sellers are still dominant but running out of energy. Each new low is smaller than the last, meaning the drop is decelerating rather than accelerating. Eventually sellers and buyers reach a rough balance, and price starts moving sideways in a choppy, low-conviction way. This is often called the "basing" phase.
From there, buyers slowly start to outnumber sellers. Nobody is rushing in aggressively at first, since confidence is still fragile after a downtrend. But as small pushes upward hold and dips get bought, more participants start believing the worst may be over. That gradual accumulation of confidence is what curves the right side of the saucer upward.
Reading volume alongside price
Volume, meaning the amount of trading activity, is often used as a supporting clue rather than the main signal. In a textbook rounding bottom, volume tends to shrink as price flattens near the bottom of the curve, reflecting waning interest and indecision. As price begins climbing the right side, volume often increases again, suggesting that participation and conviction are returning.
This isn't a strict rule, and volume can look messy in practice. But a rounding bottom with rising volume on the way up is generally considered more convincing than one where volume stays flat throughout, since real shifts in sentiment usually attract more participants over time.
Why traders wait for a breakout
Because the bottom of the curve is smooth and drawn out, there is rarely one obvious "low" moment where a trader could confidently call the reversal. Instead of guessing, many traders watch for price to break above the level where the pattern originally started trending down, sometimes called the neckline or breakout level. A move back above that zone is treated as a rough confirmation that the earlier downtrend has been overcome, rather than proof of an exact timing.
Even then, breakouts can fail, price can slip back below the level, and the pattern can simply dissolve into more sideways movement. No chart pattern guarantees what happens next.
Common mistakes and how it fits a broader plan
A frequent mistake is spotting a rounding shape too early and assuming the reversal is already confirmed, when price is still directionless in the basing phase. Another is ignoring the broader market context, since a single coin curling upward while the overall market is falling still carries real risk.
Because this pattern plays out slowly, it's best paired with patience, position sizing, and stop-loss discipline rather than urgency. It also works better alongside other tools, such as trend indicators or broader market analysis, instead of being used alone. Like any pattern, it describes a possibility in sentiment, not a certainty in price.