
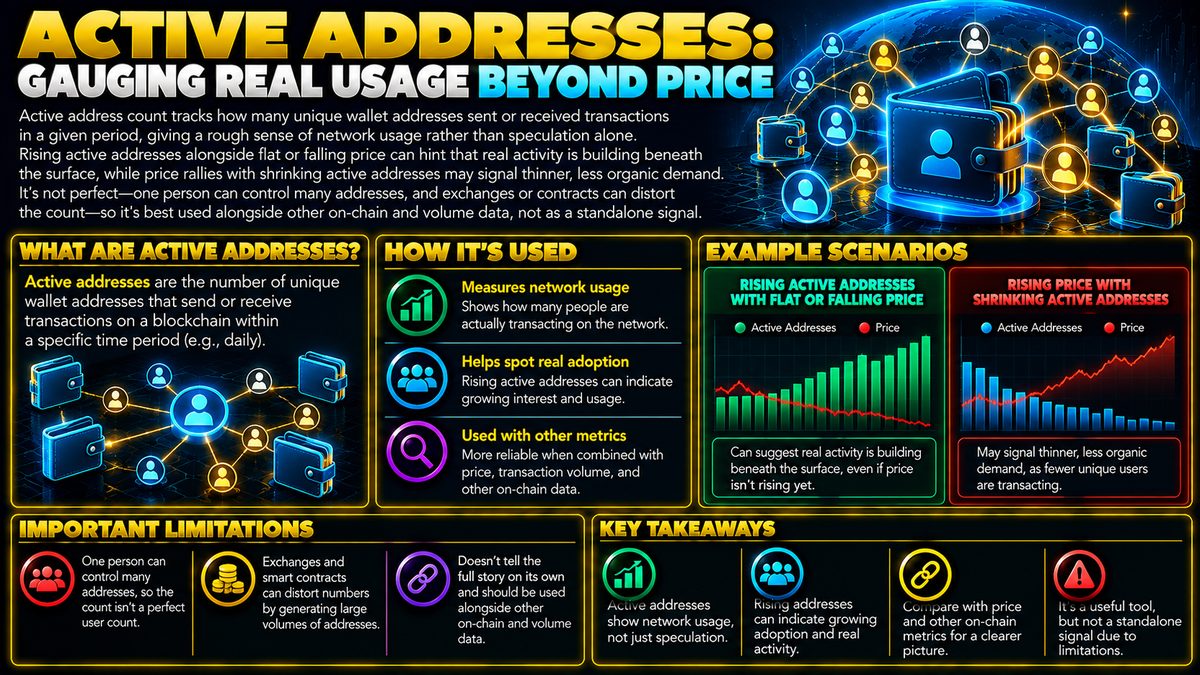
Active address count tracks how many unique wallet addresses sent or received transactions in a given period, giving a rough sense of network usage rather than speculation alone. Rising active addresses alongside flat or falling price can hint that real activity is building beneath the surface, while price rallies with shrinking active addresses may signal thinner, less organic demand. It's not perfect—one person can control many addresses, and exchanges or contracts can distort the count—so it's best used alongside other on-chain and volume data, not as a standalone signal.
What Active Addresses Actually Measure
Active address count is an on-chain metric, meaning it comes directly from data recorded on a blockchain rather than from a trading platform. For a given period, such as a day or a week, it counts how many unique wallet addresses either sent or received a transaction. A wallet address is simply the identifier that lets crypto be sent to and from a particular holder, similar in spirit to an account number.
The idea behind this metric is simple. Price and trading volume tell you how people are speculating on an asset, but they do not directly tell you how much the underlying network is actually being used to move value, interact with an application, or settle transactions. Active addresses attempt to fill that gap by giving a rough proxy for real usage.
How the Metric Forms
Every time a transaction is confirmed on a blockchain, the sending and receiving addresses become part of that period's active set. If the same address transacts multiple times in the period, it is usually only counted once, since the metric tracks unique addresses rather than total transactions. This means active address count is less about how busy the network was in raw transaction volume and more about how many distinct participants touched it.
Because this data is public, analytics providers can calculate it for almost any blockchain and chart it over time, letting traders compare current activity to recent history.
Common Ways Traders Read It
One common approach is divergence analysis, which means comparing the direction of active addresses to the direction of price. If price is flat or declining while active addresses are climbing, some traders interpret that as a sign that genuine usage is building even though speculative interest has not caught up yet. Conversely, if price is rising sharply while active addresses are shrinking or stagnant, it can suggest the rally is being driven by a smaller group of participants trading more aggressively, rather than broad organic demand.
Traders also look at active addresses relative to their own longer-term trend, treating sudden spikes or sustained plateaus as context for other decisions rather than standalone triggers. The metric is typically used as a slow-moving background indicator, not something that reacts quickly to short-term price swings.
Limitations and Common Mistakes
The biggest limitation is that one address does not equal one person. A single user can generate many wallet addresses, and some wallets automatically create new ones by default, which can inflate the count without reflecting new users. On the other side, many people can share control of a single address, such as with pooled or custodial accounts, which can understate real participation.
Exchange wallets and smart contracts add further distortion. A contract that many users interact with may itself only count as one or a few addresses, even though it is processing activity for thousands of people, while an exchange's internal transfers can create bursts of address activity unrelated to genuine trading interest.
A common mistake is treating a single day's spike as meaningful without checking whether it reflects a real shift or a one-off technical event. Another is assuming the metric predicts price direction, when in reality it only describes network usage patterns.
Using It Alongside Other Tools
Active addresses work best as one input among several, combined with trading volume, transaction fees, exchange flow data, and broader market context. No single on-chain metric or chart pattern guarantees future price behavior, and this one is no exception. Sound risk management, including position sizing and predefined exit plans, remains essential regardless of what any usage metric appears to suggest.