
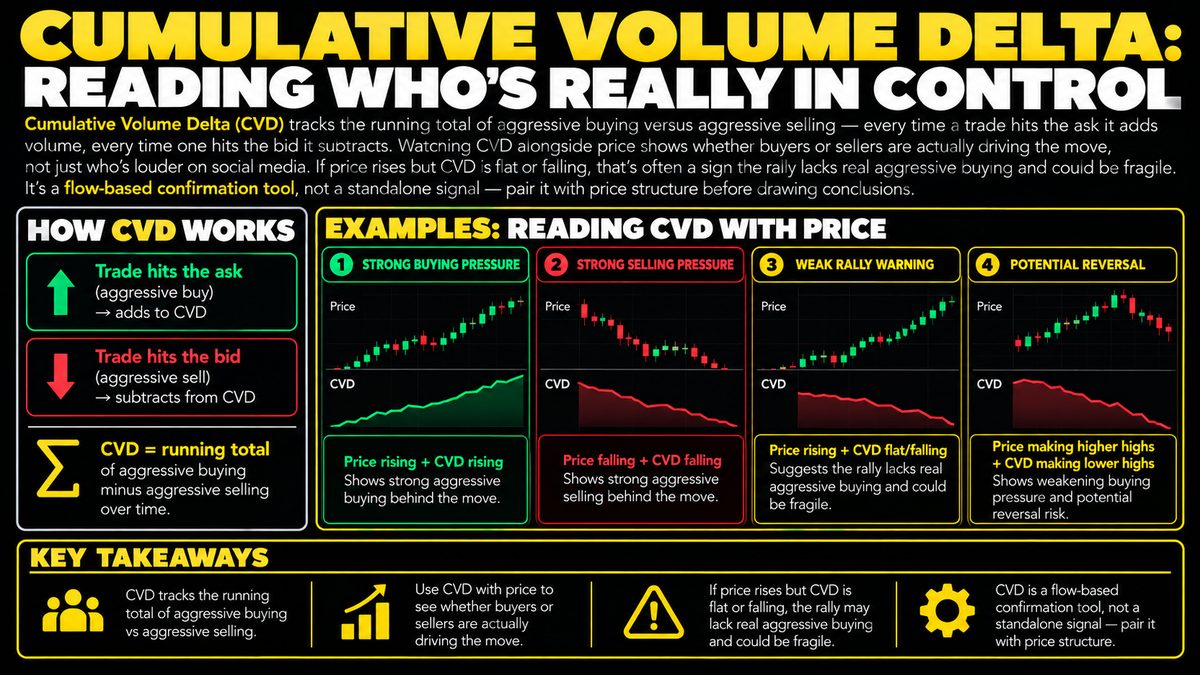
Cumulative Volume Delta (CVD) tracks the running total of aggressive buying versus aggressive selling — every time a trade hits the ask it adds volume, every time one hits the bid it subtracts. Watching CVD alongside price shows whether buyers or sellers are actually driving the move, not just who's louder on social media. If price rises but CVD is flat or falling, that's often a sign the rally lacks real aggressive buying and could be fragile. It's a flow-based confirmation tool, not a standalone signal — pair it with price structure before drawing conclusions.
What CVD Actually Measures
Every trade that happens on an order book is either a buyer hitting the ask price to get filled immediately, or a seller hitting the bid price to get filled immediately. These are called aggressive orders, because the trader initiating them is paying the spread to trade right now rather than waiting. Cumulative Volume Delta, or CVD, keeps a running score of this activity. Each trade that hits the ask adds its size to the total, and each trade that hits the bid subtracts its size. The result is a single line that climbs when aggressive buyers dominate and falls when aggressive sellers dominate.
This is different from plain volume, which just tells you how much traded without telling you who was more eager. CVD tries to separate the two sides of the tape and show which side is pushing harder, trade by trade, over time.
How CVD Forms on the Chart
CVD is usually plotted underneath a price chart as its own line or histogram, similar to how other indicators are displayed. It resets or continues depending on the settings a trader chooses, but the core idea stays the same: a rising CVD line means buyers are repeatedly paying up to get filled, and a falling line means sellers are repeatedly hitting bids to get out or short. Flat CVD means the two sides are roughly balanced, even if a lot of volume is trading.
Because it is cumulative, small imbalances add up visually over time, which can make shifts in aggressive behavior easier to spot than trying to judge raw volume bars trade by trade.
Reading CVD Alongside Price
The main use of CVD is comparing its direction to price direction, a practice sometimes called divergence analysis. If price is making higher highs while CVD is flat or trending down, that suggests the move up is not backed by strong aggressive buying, perhaps driven instead by thin order books or a few large passive orders being absorbed. Traders sometimes view this as a sign the move could be fragile or prone to reversing.
Conversely, if price and CVD rise together, that is often read as healthier, more convicted buying, since both price and the volume of aggressive buyers are moving in the same direction. The same logic applies in reverse for declines. This comparison is meant to answer a simple question, whether the people trading aggressively actually agree with the direction price is moving, rather than the move being driven by something else like low liquidity.
Common Mistakes and Limitations
A frequent mistake is treating CVD as a standalone buy or sell signal. It is a flow observation, not a prediction, and divergences can persist for a long time before anything changes, or resolve in unexpected ways. CVD also depends heavily on the data feed and the time window chosen, so the same market can look different across different tools or settings.
Another limitation is that CVD only captures aggressive taker activity. It does not show the size or intentions of the resting orders being traded against, and large hidden or passive orders can absorb aggression without CVD explaining why. It also does not account for trading happening on other venues, so any single view is necessarily partial.
Using CVD With Other Tools
Because of these gaps, CVD works best as a confirmation layer rather than a trigger. Traders often pair it with price structure such as support and resistance areas, trend context, or other indicators, using CVD to check whether a breakout or breakdown looks genuinely backed by aggressive flow or not.
As with any tool, position sizing and risk management matter more than any single reading. No pattern in CVD, or any indicator, guarantees a particular outcome, and it should be treated as one input among several when trying to understand market behavior rather than a reliable forecasting device.