
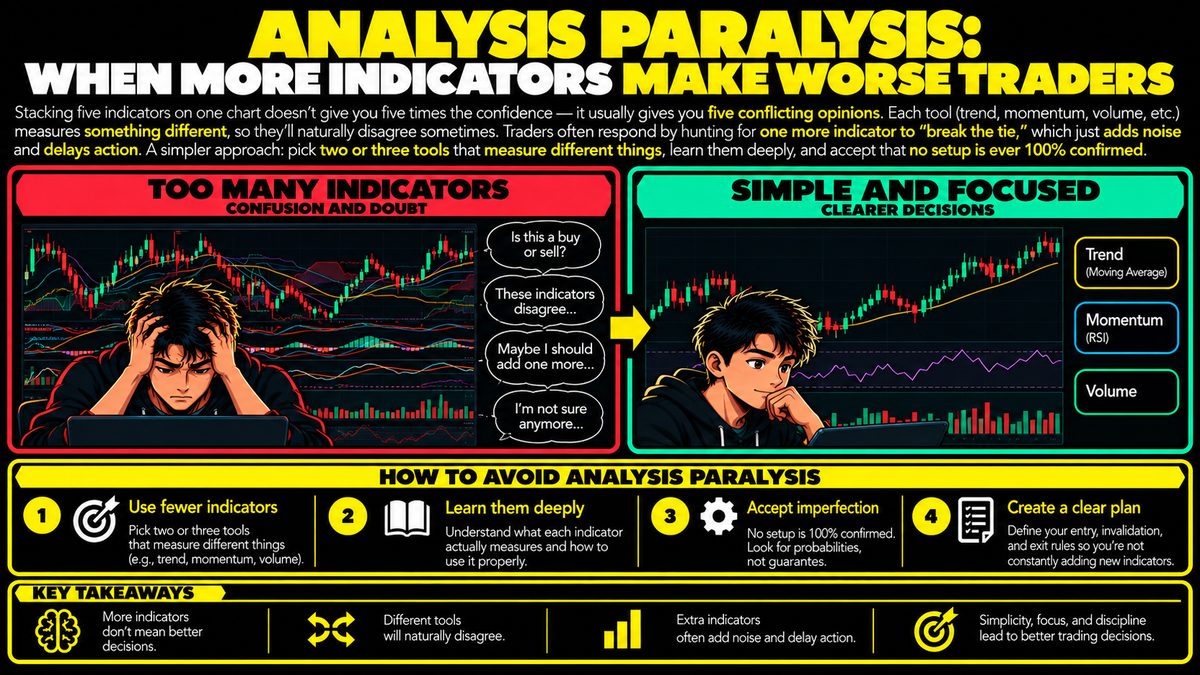
Stacking five indicators on one chart doesn't give you five times the confidence — it usually gives you five conflicting opinions. Each tool (trend, momentum, volume, etc.) measures something different, so they'll naturally disagree sometimes. Traders often respond by hunting for one more indicator to "break the tie," which just adds noise and delays action. A simpler approach: pick two or three tools that measure different things, learn them deeply, and accept that no setup is ever 100% confirmed.
Why More Tools Can Mean Less Clarity
It feels logical that adding another indicator to your chart should make your analysis stronger. In practice, it often does the opposite. Each indicator is a mathematical shortcut that summarizes one slice of market behavior, such as trend direction, momentum, volume, or volatility. Because these slices measure different things, they will not always point the same way at the same time, and that is not a flaw in the tools, it is simply how markets work.
When a trader stacks five or six indicators onto one chart, they are really asking five or six different questions at once. A trend-following tool might suggest the price is heading up, while a momentum tool suggests buyers are losing strength, and a volume tool shows little conviction either way. None of these readings are wrong. They are just answering different questions, and expecting them to agree on cue is where the frustration begins.
How the Confusion Snowballs
A common reaction to conflicting signals is to add one more indicator, hoping it will act as a tiebreaker. This rarely works, because the new tool introduces its own perspective and its own possible disagreement. Instead of resolving the conflict, the trader now has six opinions instead of five, and the decision gets harder, not easier.
This pattern is sometimes called analysis paralysis. The trader keeps gathering more information, convinced that one more data point will finally produce certainty. But markets do not offer certainty, only probabilities. The more tools layered on a chart, the more likely it is that something, somewhere, will look like a warning sign, which can freeze a trader into inaction or push them into chasing a setup after the opportunity has already passed.
What Indicators Actually Measure
It helps to think of indicators in rough categories. Some describe the direction of a trend. Some describe the speed or strength of recent price moves, known as momentum. Some describe how much trading activity is backing a move, which is volume. Others describe how much the price is swinging around, known as volatility. A single chart loaded with tools from only one category, say three different momentum indicators, is not really getting three opinions, it is getting the same opinion restated three times in different math.
Genuine diversification of analysis comes from choosing tools that measure different categories, not from piling on more tools within the same category.
A Simpler, Steadier Approach
A more workable method is to select two or three indicators that each cover a different category, then spend real time learning how they behave in different market conditions, including how they behave when they disagree. Becoming deeply familiar with a few tools tends to produce more consistent decision-making than shallow familiarity with many.
This does not eliminate conflicting signals, and it should not be expected to. Disagreement between tools is normal and often informative, since it can signal that a market is indecisive or transitioning rather than confidently trending.
Limitations and Fitting It Into a Larger Plan
No combination of indicators, however small or well chosen, guarantees an outcome. Indicators are built from past price and volume data, so they describe what has already happened, not what will happen next. Treating any setup as fully confirmed, no matter how many tools align, overstates what these tools can actually promise.
Because of this, indicator analysis works best as one input alongside clear risk management, such as deciding in advance how much capital is at stake and how a position will be managed if the market moves unexpectedly. Simplicity in analysis frees up attention for these broader decisions, which often matter more to long-term outcomes than any single signal on a chart.