
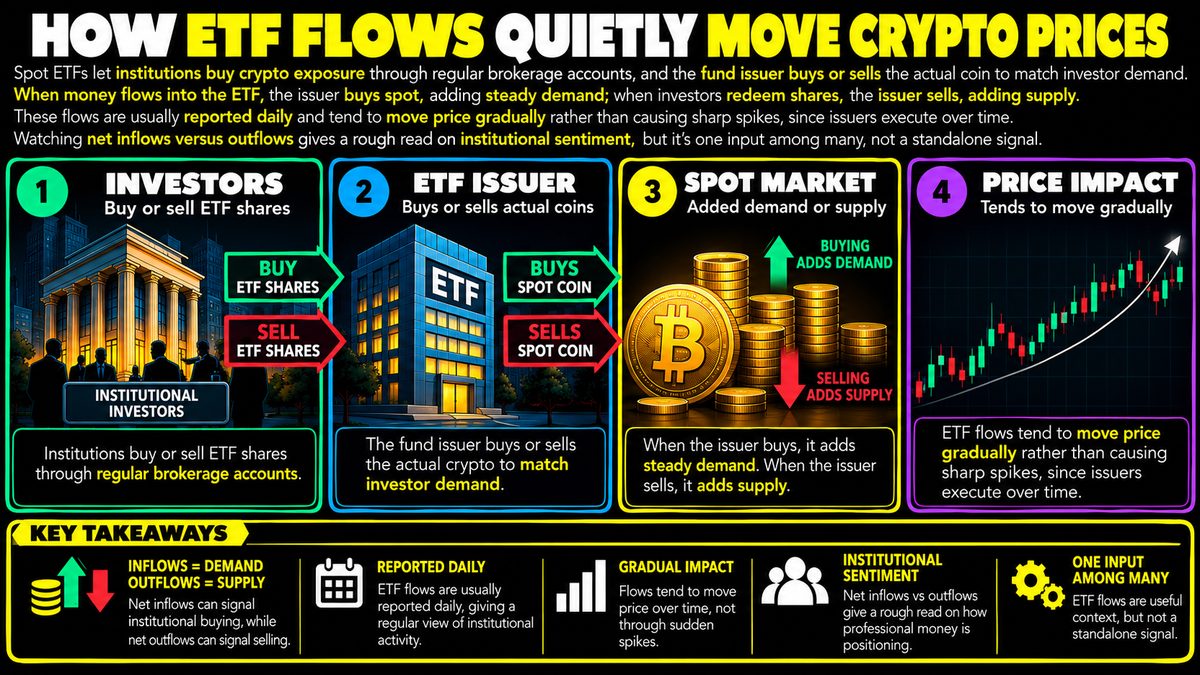
Spot ETFs let institutions buy crypto exposure through regular brokerage accounts, and the fund issuer buys or sells the actual coin to match investor demand. When money flows into the ETF, the issuer buys spot, adding steady demand; when investors redeem shares, the issuer sells, adding supply. These flows are usually reported daily and tend to move price gradually rather than causing sharp spikes, since issuers execute over time. Watching net inflows versus outflows gives a rough read on institutional sentiment, but it's one input among many, not a standalone signal.
What a spot ETF actually does
A spot exchange-traded fund, or ETF, is a product that trades on a regular stock exchange but is designed to track the price of an underlying asset, in this case a cryptocurrency. Instead of opening a crypto exchange account, buying a coin, and managing a wallet, an investor can buy shares of the ETF through an ordinary brokerage account, the same place they might buy stock in a company. Behind the scenes, the fund issuer, the company that runs the ETF, is responsible for actually holding the real coin so that the share price tracks it closely.
This matters because it creates a bridge between two worlds that used to be fairly separate, traditional brokerage money and the spot crypto market. When that bridge opens, it changes who can participate and how easily, without anyone needing to understand wallets, exchanges, or private keys.
How buying and selling shares turns into spot trades
When new money comes into the ETF, meaning investors are buying more shares than are being sold, the issuer typically needs to acquire more of the actual coin to back those new shares. That buying happens in the spot market, the market where the real asset changes hands, not a derivative or futures contract. Conversely, when investors redeem or sell off shares faster than new ones are created, the issuer may need to sell some of its coin holdings to reduce the fund's size.
This creation and redemption process is usually handled by specialized market participants working with the issuer, and it tends to happen in batches rather than constantly throughout the day. Because of that, the resulting spot buying or selling is often spread out over hours or days rather than hitting the market all at once.
Why flows tend to move price gradually
Since issuers generally try to execute their buying or selling in a controlled way, to avoid pushing the price too far in one direction, the price impact of ETF flows is usually gradual rather than explosive. A large single day of inflows might translate into steady buying pressure over that session, rather than one giant market order. This is different from, say, a sudden news event that can cause a sharp spike in minutes.
That said, gradual does not mean irrelevant. Sustained inflows over many days or weeks can add up to a meaningful source of demand, and sustained outflows can do the reverse. The key word is sustained, a single day's number rarely tells you much on its own.
Reading net inflows and outflows
Many issuers or data providers publish daily figures showing how much money moved into or out of an ETF, often summarized as net flow, which is inflows minus outflows. Traders sometimes watch these numbers as a rough proxy for institutional sentiment, since this is money coming from brokerage accounts, pension funds, or advisors rather than individual crypto traders.
A string of positive net flow days can suggest growing institutional interest, while a string of negative days can suggest the opposite. But flows are backward looking, they tell you what already happened, not what will happen next, and they say nothing certain about future price direction.
Limitations and how to use this responsibly
Flow data is just one data point among many, and it can be noisy. A single large redemption might reflect one institution rebalancing its portfolio rather than a broad shift in sentiment. It also does not capture activity happening directly on crypto exchanges, derivatives markets, or other venues, which can be far larger than ETF volumes.
No flow pattern, inflow streak, or outflow streak guarantees what price will do next. Treat this kind of information as context to combine with other tools, such as broader market trends, volume analysis, and your own risk management plan, rather than as a standalone trigger for any decision. This guide is educational and does not constitute financial advice.