
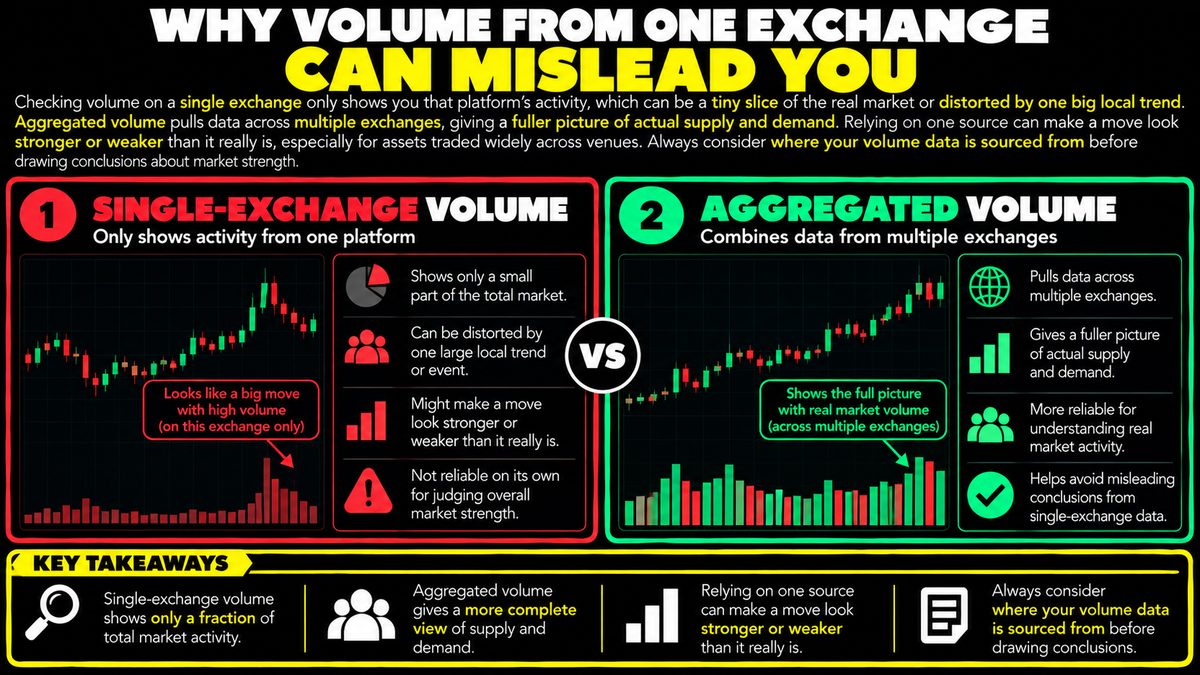
Checking volume on a single exchange only shows you that platform's activity, which can be a tiny slice of the real market or distorted by one big local trend. Aggregated volume pulls data across multiple exchanges, giving a fuller picture of actual supply and demand. Relying on one source can make a move look stronger or weaker than it really is, especially for assets traded widely across venues. Always consider where your volume data is sourced from before drawing conclusions about market strength.
What Single Exchange Volume Actually Shows
When you look at the volume figure on any single trading platform, you are seeing only the trades that happened on that specific venue. Volume, in simple terms, is the total amount of an asset that changed hands over a given period. It is often used as a rough gauge of how much interest or conviction is behind a price move. But a coin or token can trade on dozens of different platforms simultaneously, each with its own order book, its own set of users, and its own regional popularity. The number you see on one screen is a slice, not the whole pie, and that slice can vary enormously in size depending on which platform you happen to be looking at.
How Distortion Creeps In
Imagine a hypothetical coin that trades on ten different platforms. If one platform is especially popular in a particular region, or if it offers lower fees, or if a large trader happens to concentrate activity there, that single venue could show a volume spike that looks dramatic in isolation. A trader watching only that platform might conclude the whole market is surging with demand, when in reality the broader market across other venues barely moved. The reverse can also happen: a genuinely strong move across the wider market might look weak or unconvincing if you are only checking a smaller platform that captures little of the actual trading activity.
This kind of distortion becomes more pronounced with assets that are thinly traded on a given venue, where even a handful of large orders can swing the volume figure sharply without reflecting anything happening in the broader market.
Why Aggregated Volume Gives a Fuller Picture
Aggregated volume refers to data that combines trading activity across multiple exchanges into a single, more representative figure. Instead of relying on one venue's snapshot, aggregation attempts to approximate the true scale of supply and demand for an asset across the places it is actually traded. This matters most for assets that are widely listed, since their real market activity is spread thin across many venues rather than concentrated in one place. Tools and data providers that offer aggregated views exist specifically to address this blind spot, though it is worth remembering that aggregation itself depends on which exchanges are included and how reliably each one reports its data.
Common Mistakes Traders Make
A frequent mistake is treating a volume spike on one platform as confirmation of a broader market trend, without checking whether that spike is mirrored elsewhere. Another is comparing volume figures between two different assets without accounting for the fact that one might be concentrated on a single venue while the other trades heavily across many. Traders also sometimes assume that higher volume automatically means a healthier or more sustainable move, when volume alone says nothing about why the trading happened or who was behind it.
Putting Volume in Context
Volume, whether from one exchange or aggregated across several, is just one piece of information and never a guarantee of future price direction. It tends to be more useful when considered alongside other factors such as price action, overall market conditions, and an understanding of how liquid an asset actually is. Sensible risk management means not leaning heavily on any single data point, especially one as easily distorted as single exchange volume. Before drawing conclusions about how strong or weak a move really is, it is worth pausing to ask where the volume figure came from and how much of the full market it actually represents.