
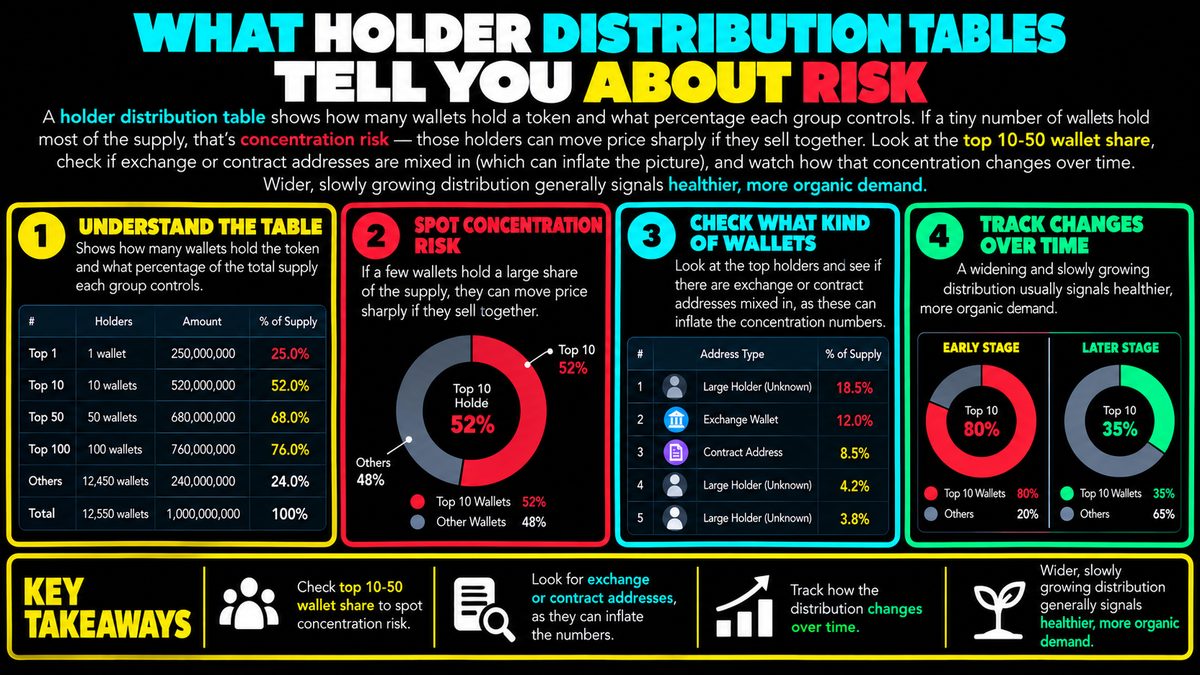
A holder distribution table shows how many wallets hold a token and what percentage each group controls. If a tiny number of wallets hold most of the supply, that's concentration risk — those holders can move price sharply if they sell together. Look at the top 10-50 wallet share, check if exchange or contract addresses are mixed in (which can inflate the picture), and watch how that concentration changes over time. Wider, slowly growing distribution generally signals healthier, more organic demand.
What a holder distribution table actually shows
A holder distribution table is a snapshot of who owns a given token, broken down by wallet address. Most blockchain explorers can generate one by scanning every wallet that holds a balance of a token and ranking them from largest to smallest. The table usually shows the top wallets, the percentage of total supply each one controls, and sometimes a running cumulative total, such as "top 10 wallets equal 62 percent of supply."
This data is public because most blockchains are transparent ledgers. Anyone can look up a token's holder list at any time. The number itself is neutral information, it simply tells you how spread out or how clustered the ownership is. What matters is how you interpret that pattern.
Why concentration matters for risk
If a small number of wallets control a large share of supply, the token carries what is usually called concentration risk. Imagine a hypothetical token where the top 5 wallets hold 70 percent of all coins. If even two or three of those wallets decide to sell at the same time, the resulting supply hitting the market could overwhelm buyers and cause a sharp price drop, regardless of what any chart pattern or indicator suggested beforehand.
This risk is not just theoretical about selling. Concentrated holders can also coordinate to influence governance votes, create artificial scarcity, or simply exit quietly over time, which gradually pressures price downward. Wide distribution, where supply is spread across thousands of smaller wallets, means no single party can move the market alone, which many traders view as a healthier structural sign, though it is not proof of anything by itself.
Reading the table correctly
A common mistake is treating every large wallet as a risky "whale" without checking what the address actually is. Exchange wallets, which hold tokens on behalf of many customers, and smart contract addresses, such as staking pools or liquidity pools, often appear near the top of these tables but do not represent a single decision-maker who might dump supply. Mixing these in in with genuine individual holders can make concentration look worse, or sometimes better, than it really is.
A more useful approach is to look at the top 10 to 50 wallet share after excluding known exchange and contract addresses, then watch how that number trends over weeks or months. A slowly declining concentration, meaning supply is spreading into more hands over time, is generally read as a sign of organic adoption. A rapidly increasing concentration, especially among new wallets, can be a warning sign worth investigating further.
Limitations and common mistakes
Holder tables have real blind spots. One wallet can control a smaller number of addresses, hiding true concentration. Labels for exchange or contract wallets are not always complete or accurate, especially on newer chains or tokens. The table also says nothing about intent, a large holder might never plan to sell, or might sell tomorrow, there is no way to know from the data alone.
It is also a mistake to treat distribution as a standalone signal. A well distributed token can still fall in price due to broader market conditions, and a concentrated one can still perform fine for long stretches of time.
Using it alongside other tools
Holder distribution works best as one input among several, alongside trading volume, liquidity depth, project activity, and your own risk tolerance. No single table, chart, or indicator guarantees future performance. Treat concentration data as a risk-awareness tool that informs position sizing and diversification decisions, not as a signal that tells you what to do next.