
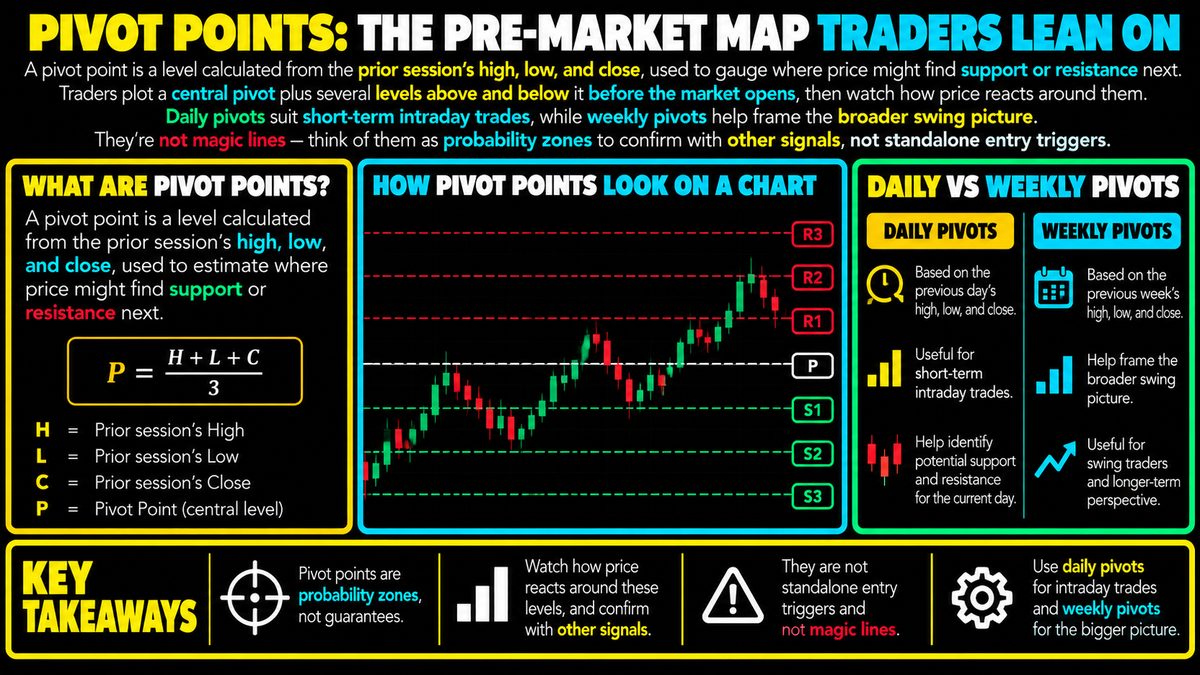
A pivot point is a level calculated from the prior session's high, low, and close, used to gauge where price might find support or resistance next. Traders plot a central pivot plus several levels above and below it before the market opens, then watch how price reacts around them. Daily pivots suit short-term intraday trades, while weekly pivots help frame the broader swing picture. They're not magic lines — think of them as probability zones to confirm with other signals, not standalone entry triggers.
How Pivot Points Are Calculated
A pivot point starts with a simple formula built from the previous session's high, low, and closing price. The most common version adds those three numbers together and divides by three, giving a central value called the pivot. From that central number, traders then calculate additional levels above it, called resistance levels, and below it, called support levels, usually labeled R1, R2, R3 and S1, S2, S3. Resistance refers to a price zone where upward movement might slow or reverse, while support refers to a zone where downward movement might slow or reverse. Because the math uses fixed inputs from the prior session, the levels are known before the new session even begins, which is why some traders treat them as a kind of pre-market map.
Daily Versus Weekly Pivots
Daily pivots are recalculated every single trading day using the prior day's high, low, and close. They tend to suit short-term or intraday traders who open and close positions within hours, since the levels refresh often and stay tightly tied to recent price action. Weekly pivots, by contrast, use the prior week's data and stay fixed for several days, which makes them more useful for framing a broader swing trade that might last days rather than hours. Neither timeframe is inherently better; they simply answer different questions. A trader watching a quick intraday move might reference the daily pivot, while someone holding a position for a week might glance at the weekly levels to understand the bigger picture.
How Traders Use the Levels
In practice, traders watch how price behaves as it approaches a pivot level rather than assuming the level will automatically hold or break. If price approaches a resistance level and stalls, some see that as a sign the move upward is losing momentum, at least temporarily. If price pushes through a level with strong volume, meaning a high number of coins changing hands, some traders interpret that as a sign the level has failed and the move may continue toward the next one. Imagine a coin trading around 100, with a calculated pivot near 100, resistance near 105, and support near 95 purely as a hypothetical. A trader might watch for how price reacts near 105 or 95 rather than placing a trade the instant the price touches those numbers.
Common Mistakes and Limitations
A frequent mistake is treating pivot levels as guaranteed turning points rather than probability zones. Price can and often does pass straight through a pivot level without any hesitation, especially during periods of high volatility or major news events. Another mistake is ignoring the broader market context, such as an overall trend or unusual trading volume, and instead reacting mechanically to a number on a chart. Pivot points are also backward looking by design, since they are built entirely from past price data, so they offer no inherent insight into future catalysts or sudden shifts in sentiment. Relying on them alone, without any other confirmation, can lead to premature entries or exits.
Fitting Pivots Into a Broader Strategy
Most experienced traders use pivot points alongside other tools rather than in isolation, such as trend lines, volume analysis, or momentum indicators, to see whether multiple signals line up before acting. This kind of confirmation does not remove risk, but it can reduce the chance of acting on a single misleading signal. Sound risk management remains essential regardless of which tools are used, including deciding in advance how much capital to risk and setting clear exit plans. No indicator, pivot points included, can predict the future with certainty, and treating them as one input among many rather than a standalone system tends to produce a more realistic approach to navigating volatile crypto markets.