
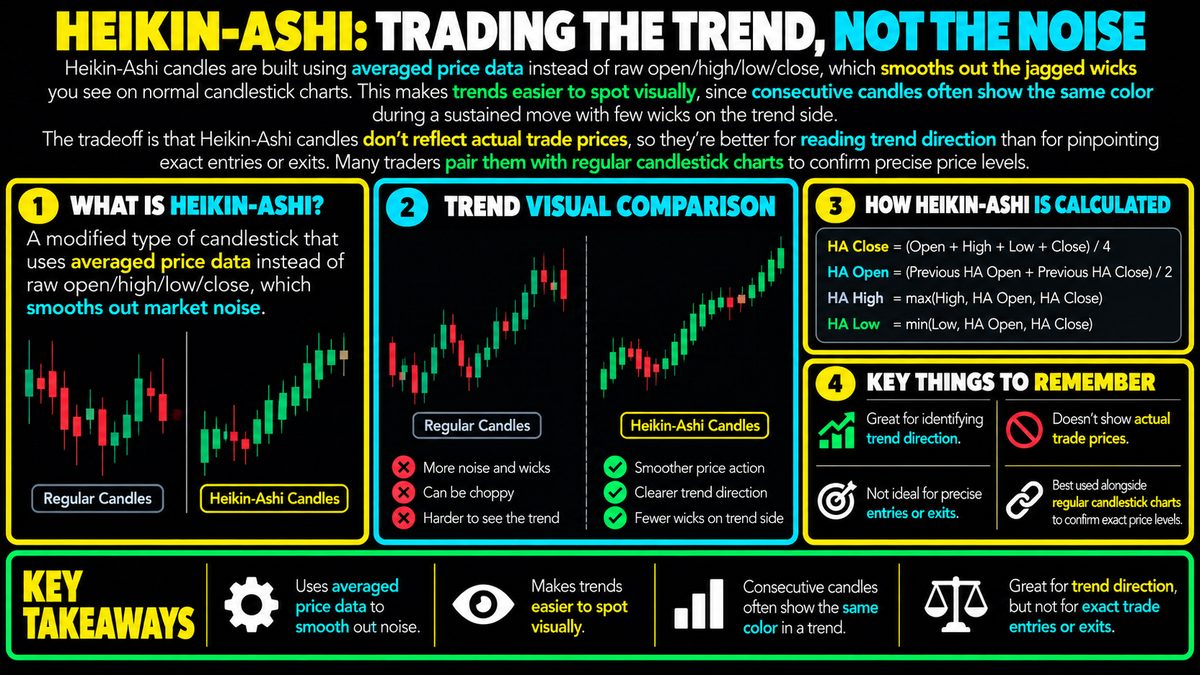
Heikin-Ashi candles are built using averaged price data instead of raw open/high/low/close, which smooths out the jagged wicks you see on normal candlestick charts. This makes trends easier to spot visually, since consecutive candles often show the same color during a sustained move with few wicks on the trend side. The tradeoff is that Heikin-Ashi candles don't reflect actual trade prices, so they're better for reading trend direction than for pinpointing exact entries or exits. Many traders pair them with regular candlestick charts to confirm precise price levels.
What Makes Heikin-Ashi Different
Heikin-Ashi is a Japanese term often translated as "average bar." Instead of plotting the raw open, high, low, and close of each trading period the way a standard candlestick chart does, Heikin-Ashi calculates each candle using a formula that blends current and prior price data. The close of each Heikin-Ashi candle is an average of that period's open, high, low, and close. The open is an average of the previous candle's open and close. The high and low are simply the most extreme values from that period, adjusted to include the new open and close. The result is a chart that looks similar to a normal candlestick chart at first glance, but behaves quite differently once you study it closely.
How the Smoothing Effect Forms
Because each candle's open is tied to the previous candle's body, Heikin-Ashi candles carry a kind of memory from one period to the next. This averaging process filters out a lot of the small back-and-forth price jitter that shows up as long wicks and sudden color flips on a regular chart. During a steady uptrend, it is common to see a long string of green candles with little or no lower wick. During a steady downtrend, the opposite tends to happen, with red candles showing little upper wick. The smoothing does not predict anything, it simply reprocesses the same price history into a visually calmer shape.
How Traders Commonly Read It
The main use case is trend reading rather than precise timing. Traders often look for consecutive same-color candles as a visual cue that a trend is intact, and they watch for a change in candle color, a shrinking body, or the appearance of wicks on both ends as a possible sign that momentum is fading. Some traders combine this with other tools, such as moving averages or trendlines, to add context rather than relying on candle color alone. None of this guarantees that a trend will continue or reverse, it is simply a way of organizing the same price information into a form that some people find easier to scan quickly.
The Core Limitation to Remember
The averaging that makes Heikin-Ashi easier to read also means the candles no longer represent actual traded prices. A Heikin-Ashi open, high, low, or close will often not match any real price that occurred on the order book during that period. This matters a great deal if you are trying to identify an exact level to watch, because the number on the chart may simply not exist in the real market. Traders who forget this sometimes get confused when their Heikin-Ashi chart shows a clean trend while the underlying price action was actually choppy and uncertain.
Combining It With Other Tools
Because of this gap between smoothed and real prices, many traders keep a standard candlestick chart open alongside the Heikin-Ashi version. The Heikin-Ashi chart is used to get a general read on trend direction and strength, while the standard chart is used to check real price levels for anything involving actual decision points. This pairing is a reminder that no single chart type or indicator tells the whole story on its own.
Risk Awareness and Final Thoughts
Heikin-Ashi is a visualization technique, not a trading system or a guarantee of future results. Markets can stay choppy, reverse without warning, or produce false signals on any chart type, smoothed or not. Anyone using Heikin-Ashi should treat it as one input among several, combine it with sound risk management such as position sizing and stop losses, and avoid treating any pattern as a certainty rather than a probability.