
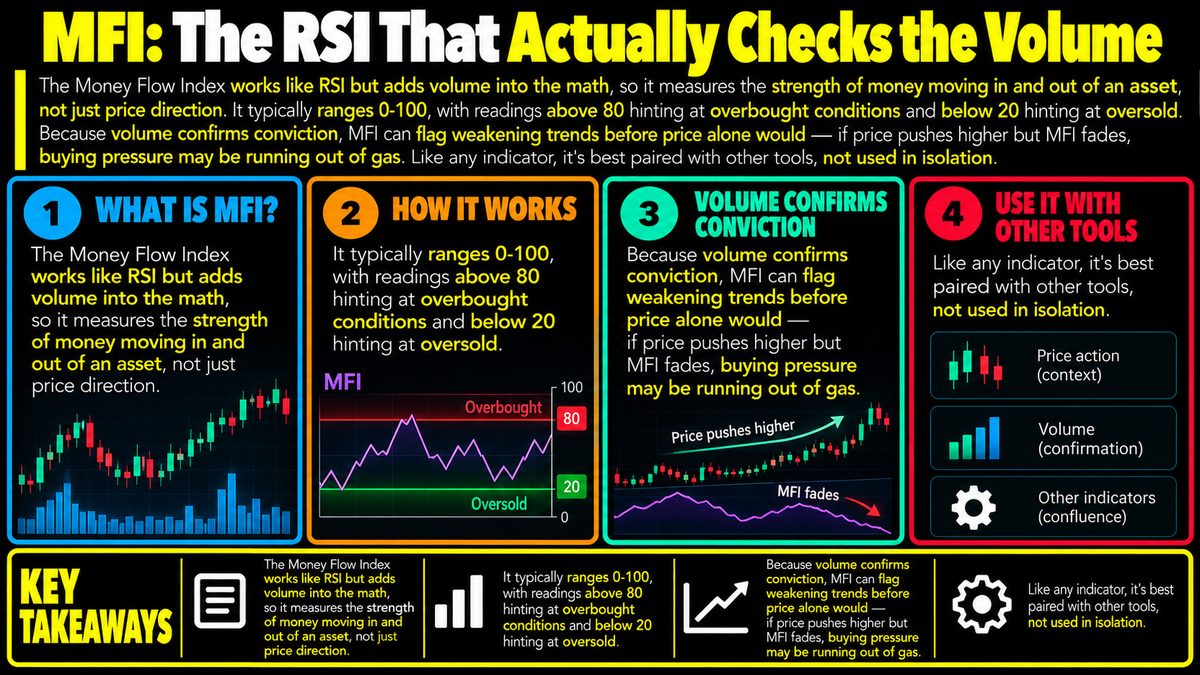
The Money Flow Index works like RSI but adds volume into the math, so it measures the strength of money moving in and out of an asset, not just price direction. It typically ranges 0-100, with readings above 80 hinting at overbought conditions and below 20 hinting at oversold. Because volume confirms conviction, MFI can flag weakening trends before price alone would — if price pushes higher but MFI fades, buying pressure may be running out of gas. Like any indicator, it's best paired with other tools, not used in isolation.
What MFI Actually Measures
The Money Flow Index, or MFI, is often described as a volume-weighted cousin of the Relative Strength Index (RSI). RSI only looks at how fast and how far price has moved up versus down over a chosen period. MFI takes that same basic idea but factors in volume, the number of units traded, so it is trying to capture not just whether price moved, but how much money was actually behind that move. The thinking is that a price change backed by heavy volume reflects stronger conviction from traders than the same price change on light volume.
To do this, MFI calculates a "typical price" for each period, usually the average of the high, low, and close, then multiplies that by volume to get what is called money flow. Periods where the typical price rose are counted as positive money flow, and periods where it fell are counted as negative money flow. The ratio between positive and negative money flow over a set lookback period, often 14 periods, is converted into a single number between 0 and 100.
Reading The Scale
Like RSI, MFI oscillates between 0 and 100, and traders commonly watch two reference zones. Readings above 80 are often described as overbought, suggesting that buying pressure has been unusually strong and may be stretched. Readings below 20 are often described as oversold, suggesting selling pressure has been intense relative to recent history. These numbers are not fixed laws, some traders use 70 and 30 instead, and what counts as extreme can vary by asset and by how volatile conditions are at the time.
It is important to understand that overbought does not mean "about to fall" and oversold does not mean "about to rise." These labels simply describe where current readings sit relative to recent history. A strongly trending asset can stay in overbought or oversold territory for extended stretches while price keeps moving in the same direction.
Spotting Divergence
One of the more popular uses of MFI is watching for divergence, which is when price and the indicator disagree. Imagine a coin pushing to a new high of 120 after previously peaking at 110, but MFI makes a lower peak this time compared to its reading at that earlier high. That mismatch can suggest that, even though price is rising, the volume-backed conviction behind the move is fading. Some traders treat this as an early warning that a trend could be losing momentum, though it is not a signal that a reversal is guaranteed or imminent.
Divergence can also appear in the opposite direction, where price makes a lower low but MFI makes a higher low, hinting that selling pressure may be easing even as price continues to slide. Divergence signals tend to play out over time rather than instantly, so acting on them without patience or confirmation can lead to early or mistimed decisions.
Common Mistakes And Limits
A frequent mistake is treating overbought or oversold readings as automatic signals rather than context. Another is ignoring that MFI, like most indicators, is backward looking, built from past price and volume, so it describes what has already happened rather than what will happen next. Thin or unusual volume data, common in less liquid markets, can also distort readings and make them less reliable.
Using MFI Alongside Other Tools
MFI tends to work best as one input among several, rather than a standalone trigger. Pairing it with trend tools, support and resistance levels, or price action can help filter out false signals. Whatever approach is used, thoughtful position sizing and risk management remain essential, since no indicator, including MFI, can guarantee future outcomes.