
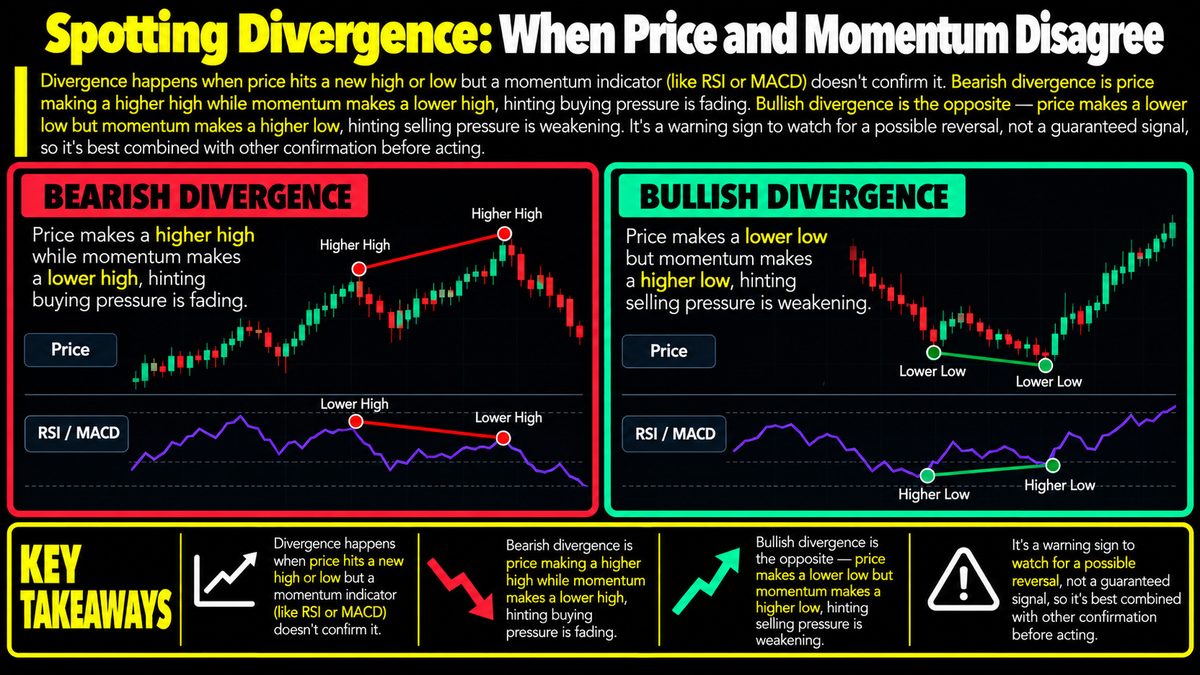
Divergence happens when price hits a new high or low but a momentum indicator (like RSI or MACD) doesn't confirm it. Bearish divergence is price making a higher high while momentum makes a lower high, hinting buying pressure is fading. Bullish divergence is the opposite — price makes a lower low but momentum makes a higher low, hinting selling pressure is weakening. It's a warning sign to watch for a possible reversal, not a guaranteed signal, so it's best combined with other confirmation before acting.
What Momentum Indicators Actually Measure
Price tells you where a market has been, but it does not tell you how much energy pushed it there. Momentum indicators try to fill that gap by measuring the speed and strength of recent price moves rather than price itself. Two of the most common are the Relative Strength Index (RSI), which measures how strong recent gains are compared to recent losses on a scale of 0 to 100, and the Moving Average Convergence Divergence (MACD), which compares two moving averages of price to show whether momentum is accelerating or slowing. Normally, price and momentum move together: as price pushes to new highs, momentum tends to push higher too, because the move is backed by strong buying. Divergence is simply the moments when that relationship breaks down.
How Divergence Forms
Imagine a coin trading at 100 that rallies to 120, pulls back, then rallies again to 130. If momentum at the 130 high is actually lower than momentum was at the 120 high, that is bearish divergence: price made a higher high, but the underlying strength behind that move was weaker than before. It suggests fewer buyers are willing to push the price further, even though the chart looks strong on the surface.
Bullish divergence works the same way in reverse. Say the coin falls from 100 to 80, bounces, then drops again to 70. If momentum at 70 is higher than it was at 80, sellers are technically pushing price lower but with less force each time. That fading selling pressure is read as a possible early sign that the downtrend is losing steam.
How Traders Read and Use It
Divergence is generally treated as a warning light, not a trade trigger on its own. Traders often use it to become more cautious about an existing trend, to tighten risk management on open positions, or to watch more closely for other signs of a turn, such as a trendline break, a candlestick reversal pattern, or a shift in trading volume. Because divergence can appear well before price actually reverses, and sometimes never leads to a reversal at all, many traders wait for price action itself to confirm the shift before acting, rather than reacting to the divergence alone.
Common Mistakes and Limitations
A frequent mistake is treating divergence as a precise timing tool, as if it tells you the exact top or bottom. In reality, momentum can diverge for extended periods while price keeps trending, especially in strong trends where buying or selling pressure stays dominant even as it gradually weakens. Another mistake is spotting divergence on very short timeframes and assuming it carries the same weight as divergence on daily or weekly charts, where it tends to be considered more significant. Divergence also does not work well in choppy, sideways markets, where momentum naturally swings back and forth without any real trend to diverge from.
Fitting It Into a Broader Approach
Divergence is most useful as one input among several, not a standalone system. Pairing it with support and resistance levels, volume analysis, or broader market context can help filter out weaker signals. Because no indicator, including divergence, can guarantee what price will do next, risk management remains essential: position sizing, stop-loss planning, and accepting that any single signal can simply be wrong. Used this way, divergence becomes a tool for asking better questions about a trend's health, rather than a shortcut for predicting its end.