
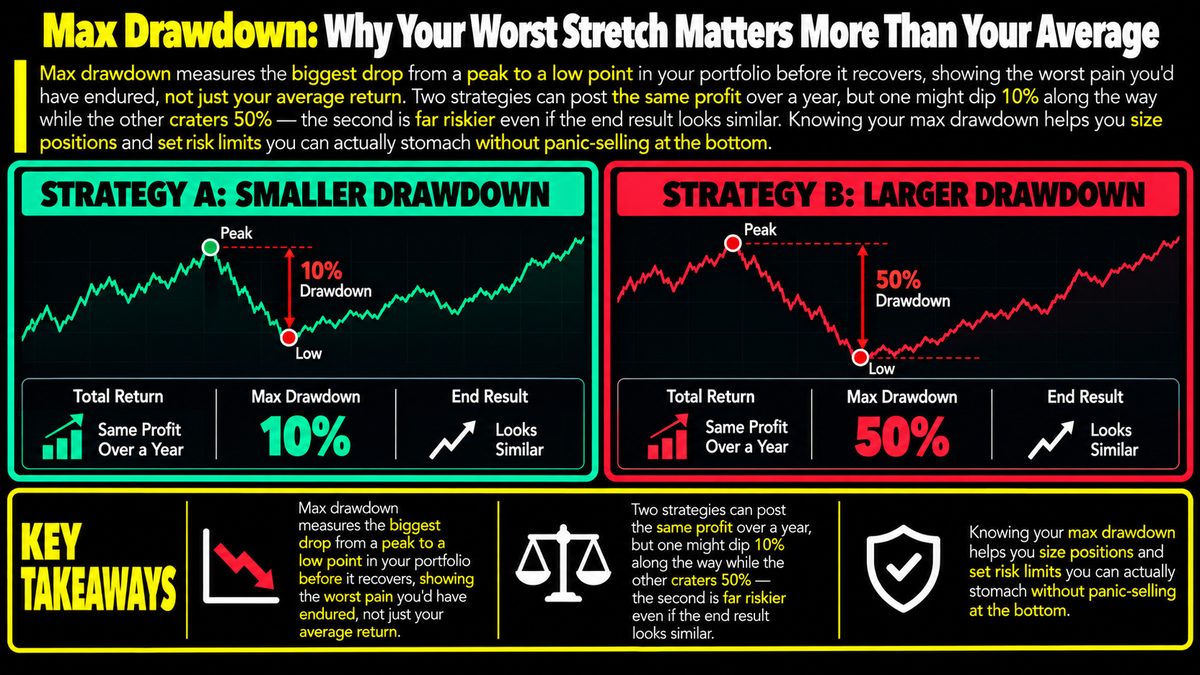
Max drawdown measures the biggest drop from a peak to a low point in your portfolio before it recovers, showing the worst pain you'd have endured, not just your average return. Two strategies can post the same profit over a year, but one might dip 10% along the way while the other craters 50% — the second is far riskier even if the end result looks similar. Knowing your max drawdown helps you size positions and set risk limits you can actually stomach without panic-selling at the bottom.
What Max Drawdown Actually Measures
Max drawdown is the largest percentage drop your portfolio or a specific strategy experiences from a peak value down to the lowest point reached before a new peak is set. It is not about how much you lost on a single trade, but about the worst continuous slide in your account's value over a stretch of time. If your portfolio grows from an imaginary 1,000 to 1,500, then falls to 900 before eventually climbing again, your drawdown from that peak was about 40%, measured from 1,500 down to 900, regardless of what happens afterward.
This number is backward-looking by nature. It tells you what has already happened, not what will happen next. Two different periods, even for the same strategy, can produce very different drawdowns depending on market conditions, so a historical max drawdown is a description of past pain, not a guaranteed ceiling on future pain.
Why Average Returns Can Be Misleading
Average return numbers flatten out the journey. A strategy that returns 20% over a year sounds appealing on paper, but that single figure hides whether the path there was a smooth climb or a terrifying rollercoaster. Two strategies can finish the year at the same profit level while one only dipped 10% from its peak along the way and the other plunged 50% before recovering.
That difference matters enormously in practice. A 50% drawdown requires a 100% gain just to get back to even, while a 10% drawdown only needs about an 11% gain to recover. The deeper the hole, the harder the climb out, which is why traders who only look at end-of-period returns can seriously underestimate how risky a strategy actually was to hold.
How Traders Use Drawdown Information
Knowing the historical drawdown of an approach, whether it is a personal trading strategy or a broader portfolio allocation, helps with sizing decisions. If a strategy has shown drawdowns of 40% in the past, a trader might choose to allocate a smaller portion of capital to it, simply because they know, realistically, whether they could tolerate watching that much value disappear without abandoning the plan at the worst possible moment.
Drawdown figures are also used to set risk limits in advance. A trader might decide beforehand that if a strategy or position falls a certain percentage from its peak, they will reduce exposure or step back entirely. Deciding this calmly, before emotions are involved, tends to produce better outcomes than reacting in the middle of a sharp decline.
Common Mistakes and Limitations
A frequent mistake is assuming that past drawdown is the worst that could ever happen. Markets can always produce a larger decline than anything seen in a given historical sample, especially in volatile markets like crypto where conditions can shift quickly. Treating max drawdown as a hard limit rather than a rough guide can lead to false confidence.
Another limitation is that drawdown alone does not tell you how long the recovery took, or whether the strategy ever recovered at all. A short, sharp drawdown that bounces back quickly feels very different from a long, grinding decline that takes years to recover, even if the percentage drop is identical on paper.
Fitting Drawdown Into a Broader Risk Approach
Max drawdown works best alongside other tools, not alone. Position sizing, diversification, and clear stop-loss rules all help manage the kind of risk that drawdown measures after the fact. No single metric or pattern can promise protection, and past drawdown figures are not predictions of future results.
Ultimately, understanding your own tolerance for loss, and building a plan around numbers you can actually sit through without panic-selling, matters more than chasing the highest possible average return.